Adding the C_Tickers Table Chart
Procedure
-
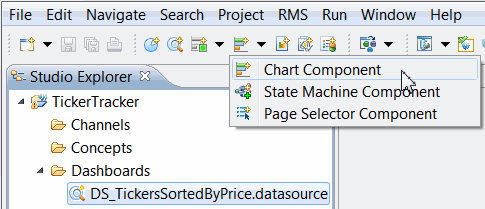
In TIBCO BusinessEvents Studio Explorer, select the
DS_TickersSortedByPrice data source. Click the
New Chart Component
 toolbar button. (It is in the Component drop-down list.)
- You see the New Chart wizard. Name the chart C_Tickers and click Next.
- At the Select a Chart Type page select Table and subtype Simple with the same categories for every series (the default for Table type charts), and click Next.
-
At the Select Layout Options page do the following:
- In the Chart field type Tickers. This text becomes the chart title. (The default title is the chart name.)
- In the Category Column field, type Tickers. This text becomes the column header text.
- In the Chart Size area, click the middle top square, so that two squares are colored, to specify that the chart will be one unit high and two units wide. Units are measured in pixels (see TIBCO BusinessEvents Views Developer’s Guide for details).
As you define the chart in the wizard, the Chart Preview (located in the upper right corner of the page) updates to illustrate how it will appear. - Click Next.
- Skip the Enter Chart Preview Options page. Just click Next.
-
At the Configure Data Options page do the following:
- In the Data Settings section, Series Name field, type Price (replacing the placeholder text SeriesConfig_). Note that the value field for this series, lower in the window, defaults to Price, which is the desired field.
-
Click
Add to add a second series. In the
Series Name field, type
Volume and in
Value Field, select
Volume.
The Measure field specifies the metric to use for a series and the Data Source field specifies the data source. These two types of resources define the data inputs for a chart series. These resources can be same or different for each series, as needed.
-
Click
Finish.
The chart is saved automatically and opens in the Chart editor.
Copyright © Cloud Software Group, Inc. All rights reserved.

