State Model Component
If you use the TIBCO BusinessEvents Data Modeling add-on you, can configure state model components that enable dashboard users to work with visualizations of state models in Dashboard.
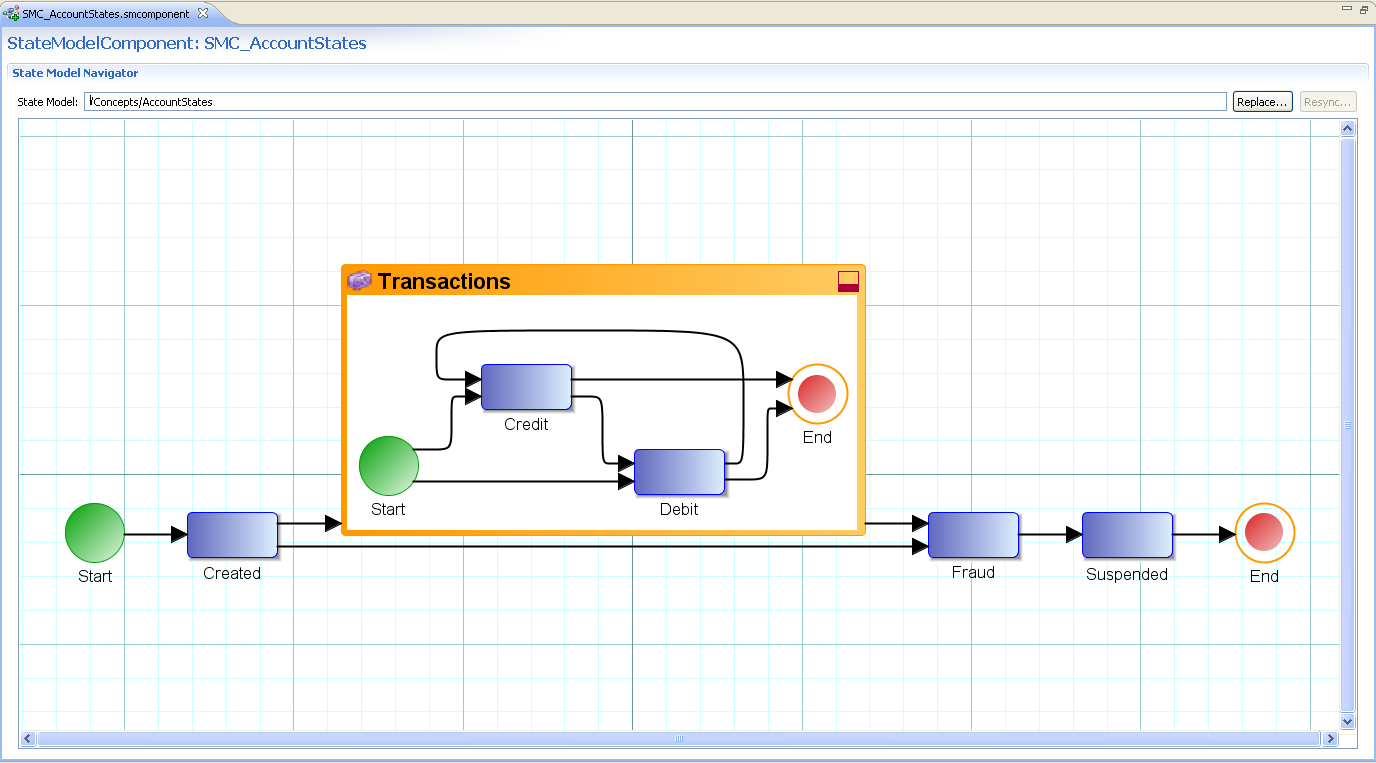
A state model component provides a visual representation of a state model in a project.
The design-time canvas-based user interface looks similar to the following:
State Model Component Example
As a simple example, consider a state model for tracking bank account applications. The state model component has two states (nodes), received and processed. Bank officials want to know for the year so far, how many applications have been received, and how many applications are actually processed. To do this you could choose a metric and data source for each state to provide the information, and configure it to show the count in each state node. Depending on data available, you could configure one node to show the applications processed as a percentage of those received, in a given period.

