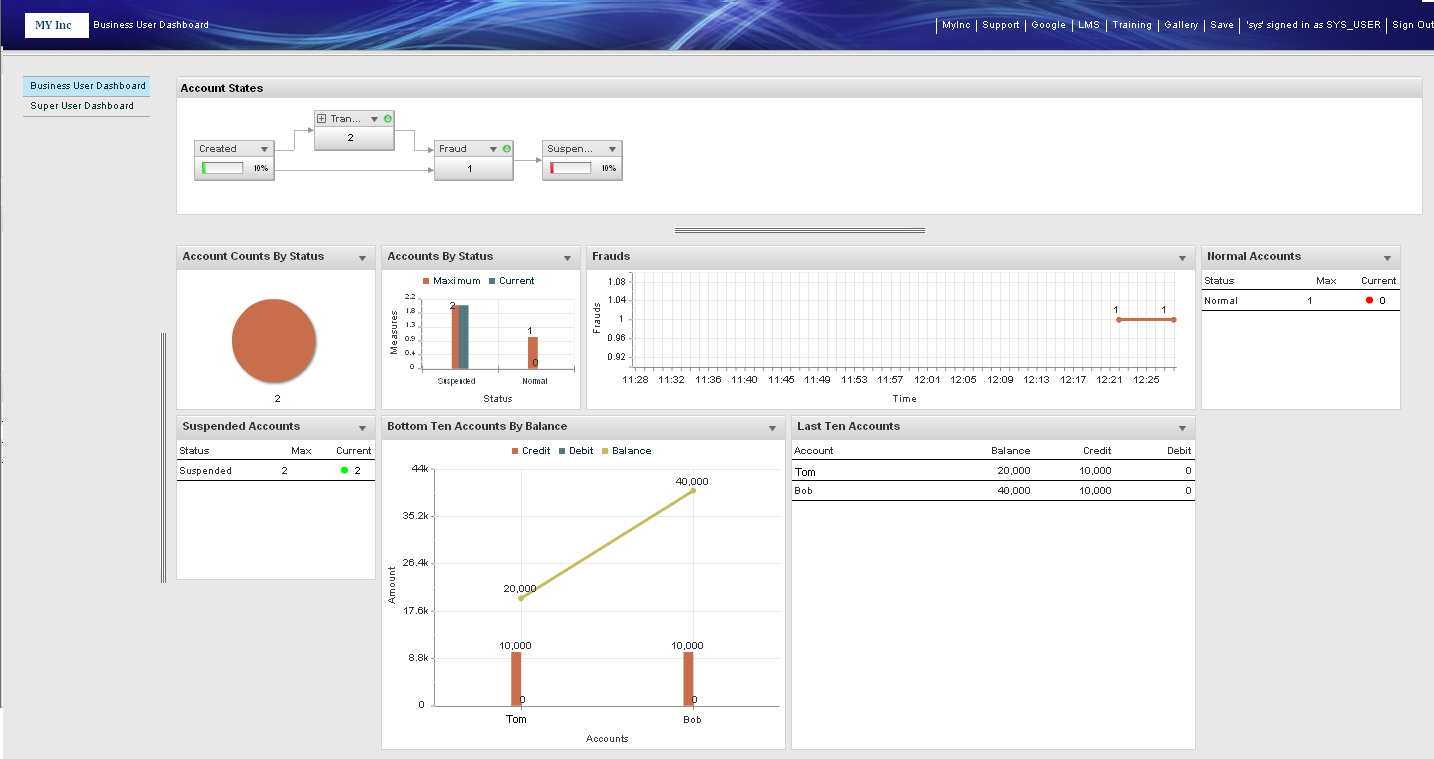
Dashboard User Interface Features
Each dashboard provides one or more pages that display the status of business processes and operations, and visual alerts to identify exceptions.
Various features help you use Dashboard and configure it to your needs. Developer-level configuration can enable or restrict what you do. You can personalize Dashboard to the extent permitted by developer-level configuration.
Dashboard has the following features and components:
| Components | Features |
|---|---|
| Command Bar | The commands are displayed in the command bar, which is in the upper-right corner of the window. |
| Dashboard Pages | The dashboard pages contain selections of charts, tables, and state machine components (if available). |
| Page Selector | You can switch between multiple dashboard pages using page selector present generally to the left. |
| Chart Galleries | The chart gallery enables you to select from various charts available. |
| View | Developers assign a set of pages and charts to a view. Each user role is assigned one view. If you have multiple user roles you can switch between them (using the role selector) to use different views. |
| Role Selector | You can switch between roles (and therefore views) using role selector in the command bar. Only one role is used at a time. |
| Chart | The Charts are visual representations of metric values. You can change chart parameters using quick edit. When you hover over different areas of a chart, tooltips display a technical description of the data. |
| State Machine Component | Metric values on a visual representation of a state machine. This feature requires use of the TIBCO BusinessEvents Data Modeling add-on. |
| Data Point | A data point is a metric value shown on a chart or in a table or state machine component. A data point is generated by the underlying data and is updated in real time. Depending on configuration you can drill down on data points to see more detail about the underlying data on the search page. |
| URL Links | The URL links menu option opens a list of useful URL links related to the chart you are viewing (if developers configured this feature). URL links can also be viewed in the search page on specific metric fields. |
| Alerts | Visual notifications on a chart, table, state machine component indicating unusual conditions that may need your attention. Tooltips provide textual information about the conditions. |
| Metric | A metric is a set of formulas computed real-time on data received by TIBCO BusinessEvents. Metrics are stored as records in the database. They are used to present datapoints on charts. On the search page, you can make queries that return metric data. |
| Concept | A concept is a record in the database that describes some kind of entity, such as a customer, an order, and so on. Developers can configure metric fields to display links to concepts (or metrics or external URLs). On the search page, you can make queries that return concept data. |
| Drilldown | You can click Drilldown on a data point or alert to view more information on the search page. |
| Query Manager | The Query Manager enables you to query concepts and metrics in the database to view or export. |
| Drilldown Result | This section of the search page displays query results as well as drilldown results |
Copyright © Cloud Software Group, Inc. All rights reserved.

