Alerts
As configured by the Dashboard developers, alerts show exceptional business conditions on dashboard elements. Alerts can be indicated using graphics or changes in text or background color, depending on the type of Dashboard component, and on developer-level configuration.
For example, in the state machine component as shown in the figure, the green color of the bar on the left indicates a normal condition. The red color of the bar on the right indicates a condition of concern. Similarly, the circular alert indicators in the title bar of the states indicates normal or unusual conditions.
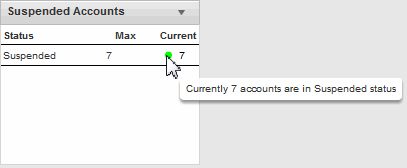
Similar color changes and alert indicators can appear on charts. For example the image shows text relating to is a normal condition indicator on a chart.
You can hover the pointer over an alert indicator to see text that relates to the condition as shown.


