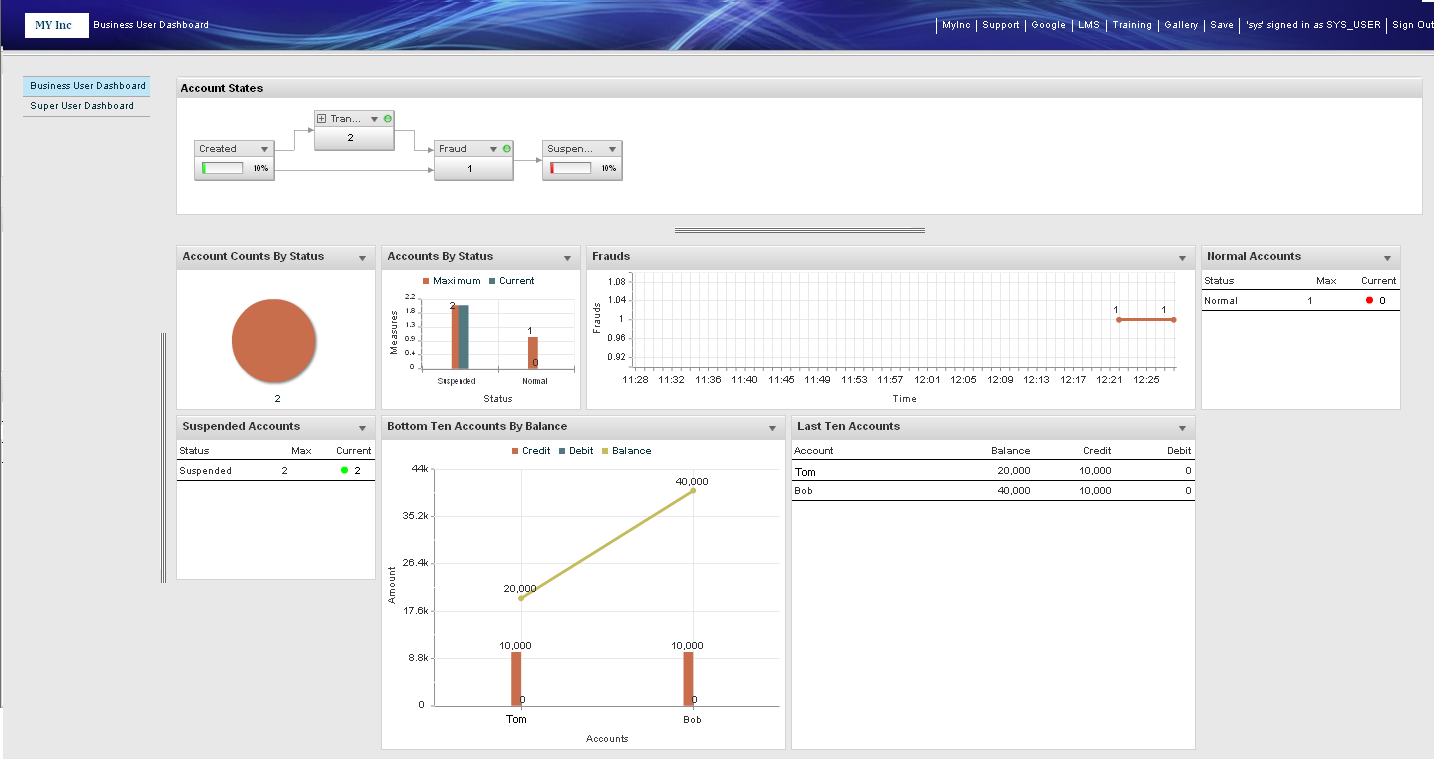
Structure of Dashboard
The Dashboard UI can present multiple dashboard pages, which Dashboard users navigate between using a page selector. Each dashboard page displays various dashboard components.
The dashboard components include charts, tables, and (if TIBCO BusinessEvents Data Modeling is used) state model components. You can also create galleries of charts that are available for various user roles.
Chart components show not only real-time filtered to usable information, but also alerts that highlight exceptional business conditions.
To understand Dashboard from the Dashboard user’s point of view, read TIBCO BusinessEvents Views User’s Guide.
Copyright © Cloud Software Group, Inc. All rights reserved.

