Table Chart Column Width Options
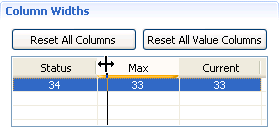
Column Widths controls the width of columns in a table chart. A graphical gadget helps you to configure the widths as desired.
Category Column (on the left) - The category column is the left most column. It displays the name specified in the Header Row > Category Column Header section of this page.
Value Columns - One value column per series displays in the column width UI, to the right of the category column. When you add and name a series on the Data Settings tab, the series names appear in the Column Widths section here.
Specifying Column Widths
You can specify column widths in the following ways:
- Reset All Columns
- Click this button to distribute the space evenly across all columns, including the category column.
- Reset All Value Columns
- Click this button to distribute the space evenly across all the value columns, leaving the category column as is. This button is enabled only when the table chart uses multiple series.
- Drag column borders
- Resize the columns as desired by dragging their borders. The number in each column displays the column width as a percentage of total table width.
- Specify percentage width
- You can also resize the columns by entering each column’s width as a percentage of total table width.
Copyright © Cloud Software Group, Inc. All rights reserved.

