Viewing Application Monitoring Dashboard
You can view App Instances, Endpoints and Processes for a running application from the application monitoring dashboard.
Procedure
-
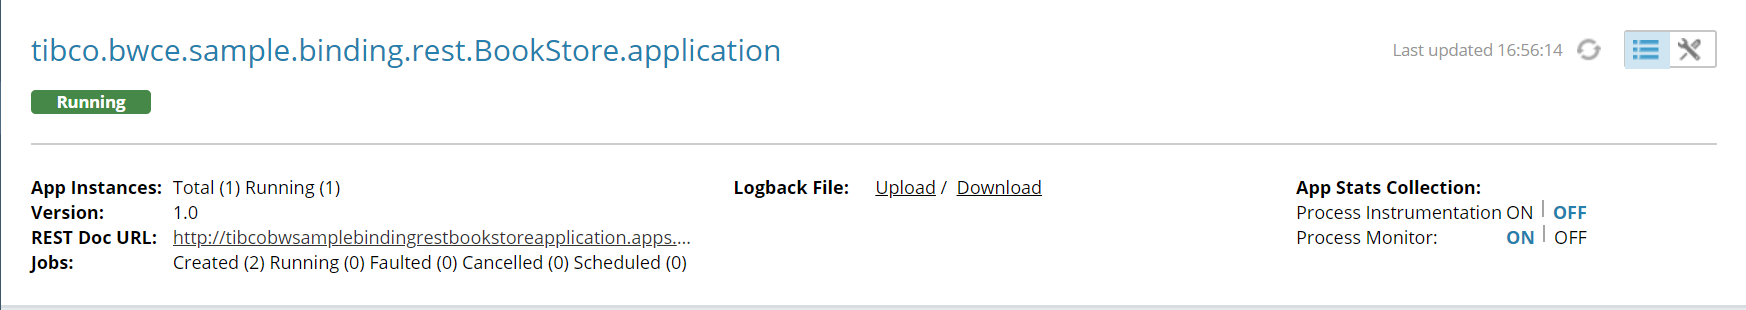
View the application status on the
Application page. The monitoring dashboard displays the following information as per grouped in Cloud Foundry spaces:
- Total number of Application Instances, the application instances (container), and running number of instances.
- Application version
- REST Doc URL
Note: The REST Doc URL is shown, if the application have swagger endpoint. REST Doc URL for docker is an internal endpoint and cannot be access externally. If you are exposing the TIBCO BusinessWorks™ Container Edition application externally, then the REST Doc URL can be accessed at http://<External URL>/swagger.
- Number of created jobs, running jobs, faulted jobs, cancelled jobs and scheduled jobs.
- To upload or download a logback file click the Upload or Download link, from the monitoring dashboard.
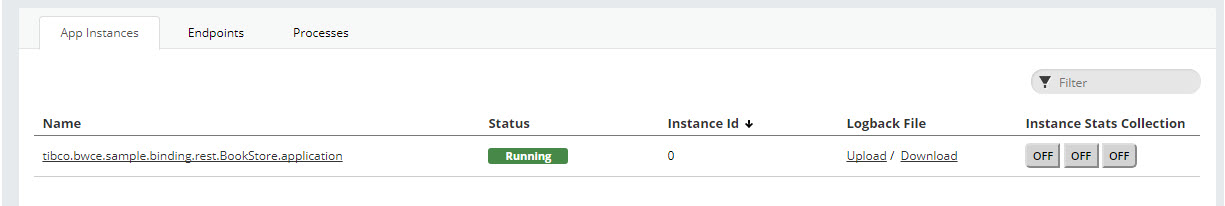
- To view app instances of an application, click App Instances tab. You can also upload and download the logback file from the App Instances tab.
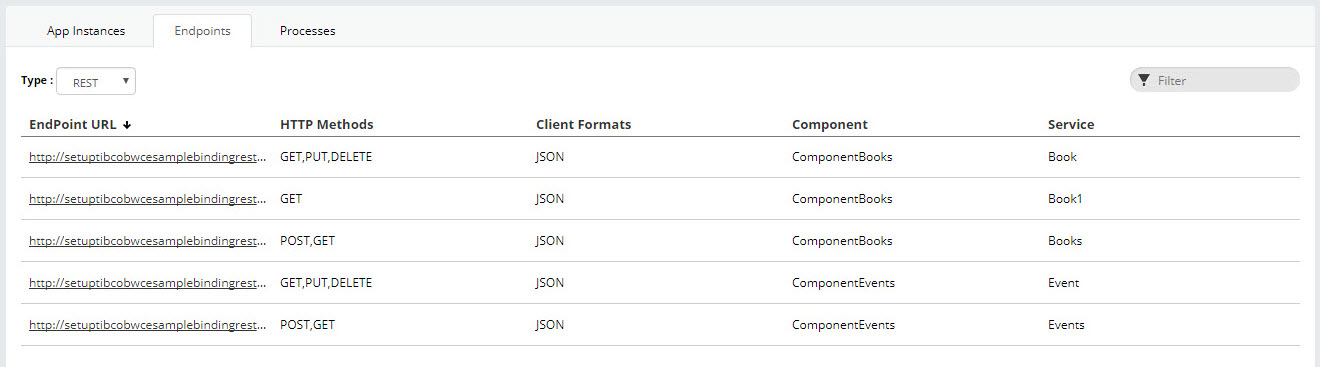
- Click the Endpoints tab to view endpoints exposed by the application. The type of endpoint is displayed at the top of the tab.
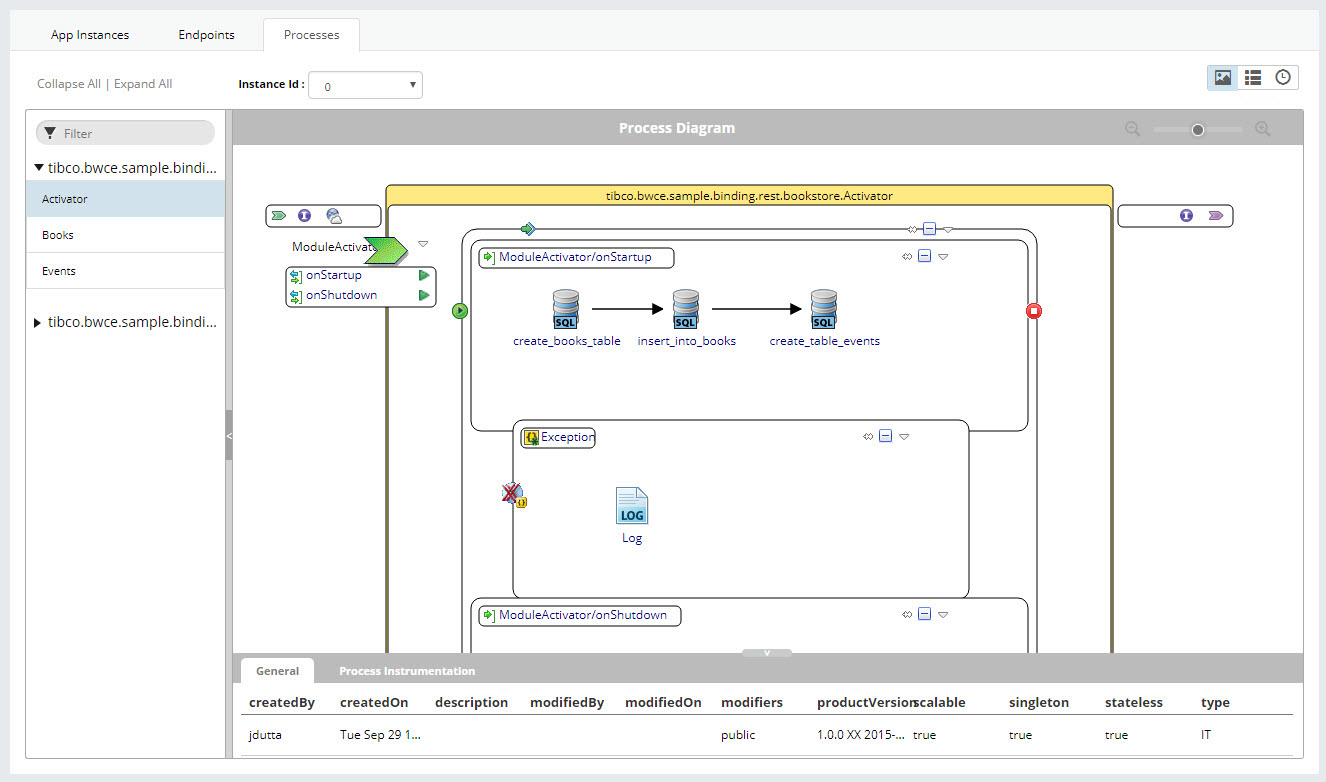
- Open the Processes tab to view application process diagram.
Copyright © Cloud Software Group, Inc. All rights reserved.