Using the Debugger
The debugger enables different configurations of an application to be run in design phase.
By default, the debugger lists all the process and sub processes of an application module, shared module and nested shared module in the debug configuration window. You can select applications, and processes in an application, to launch in the debugger.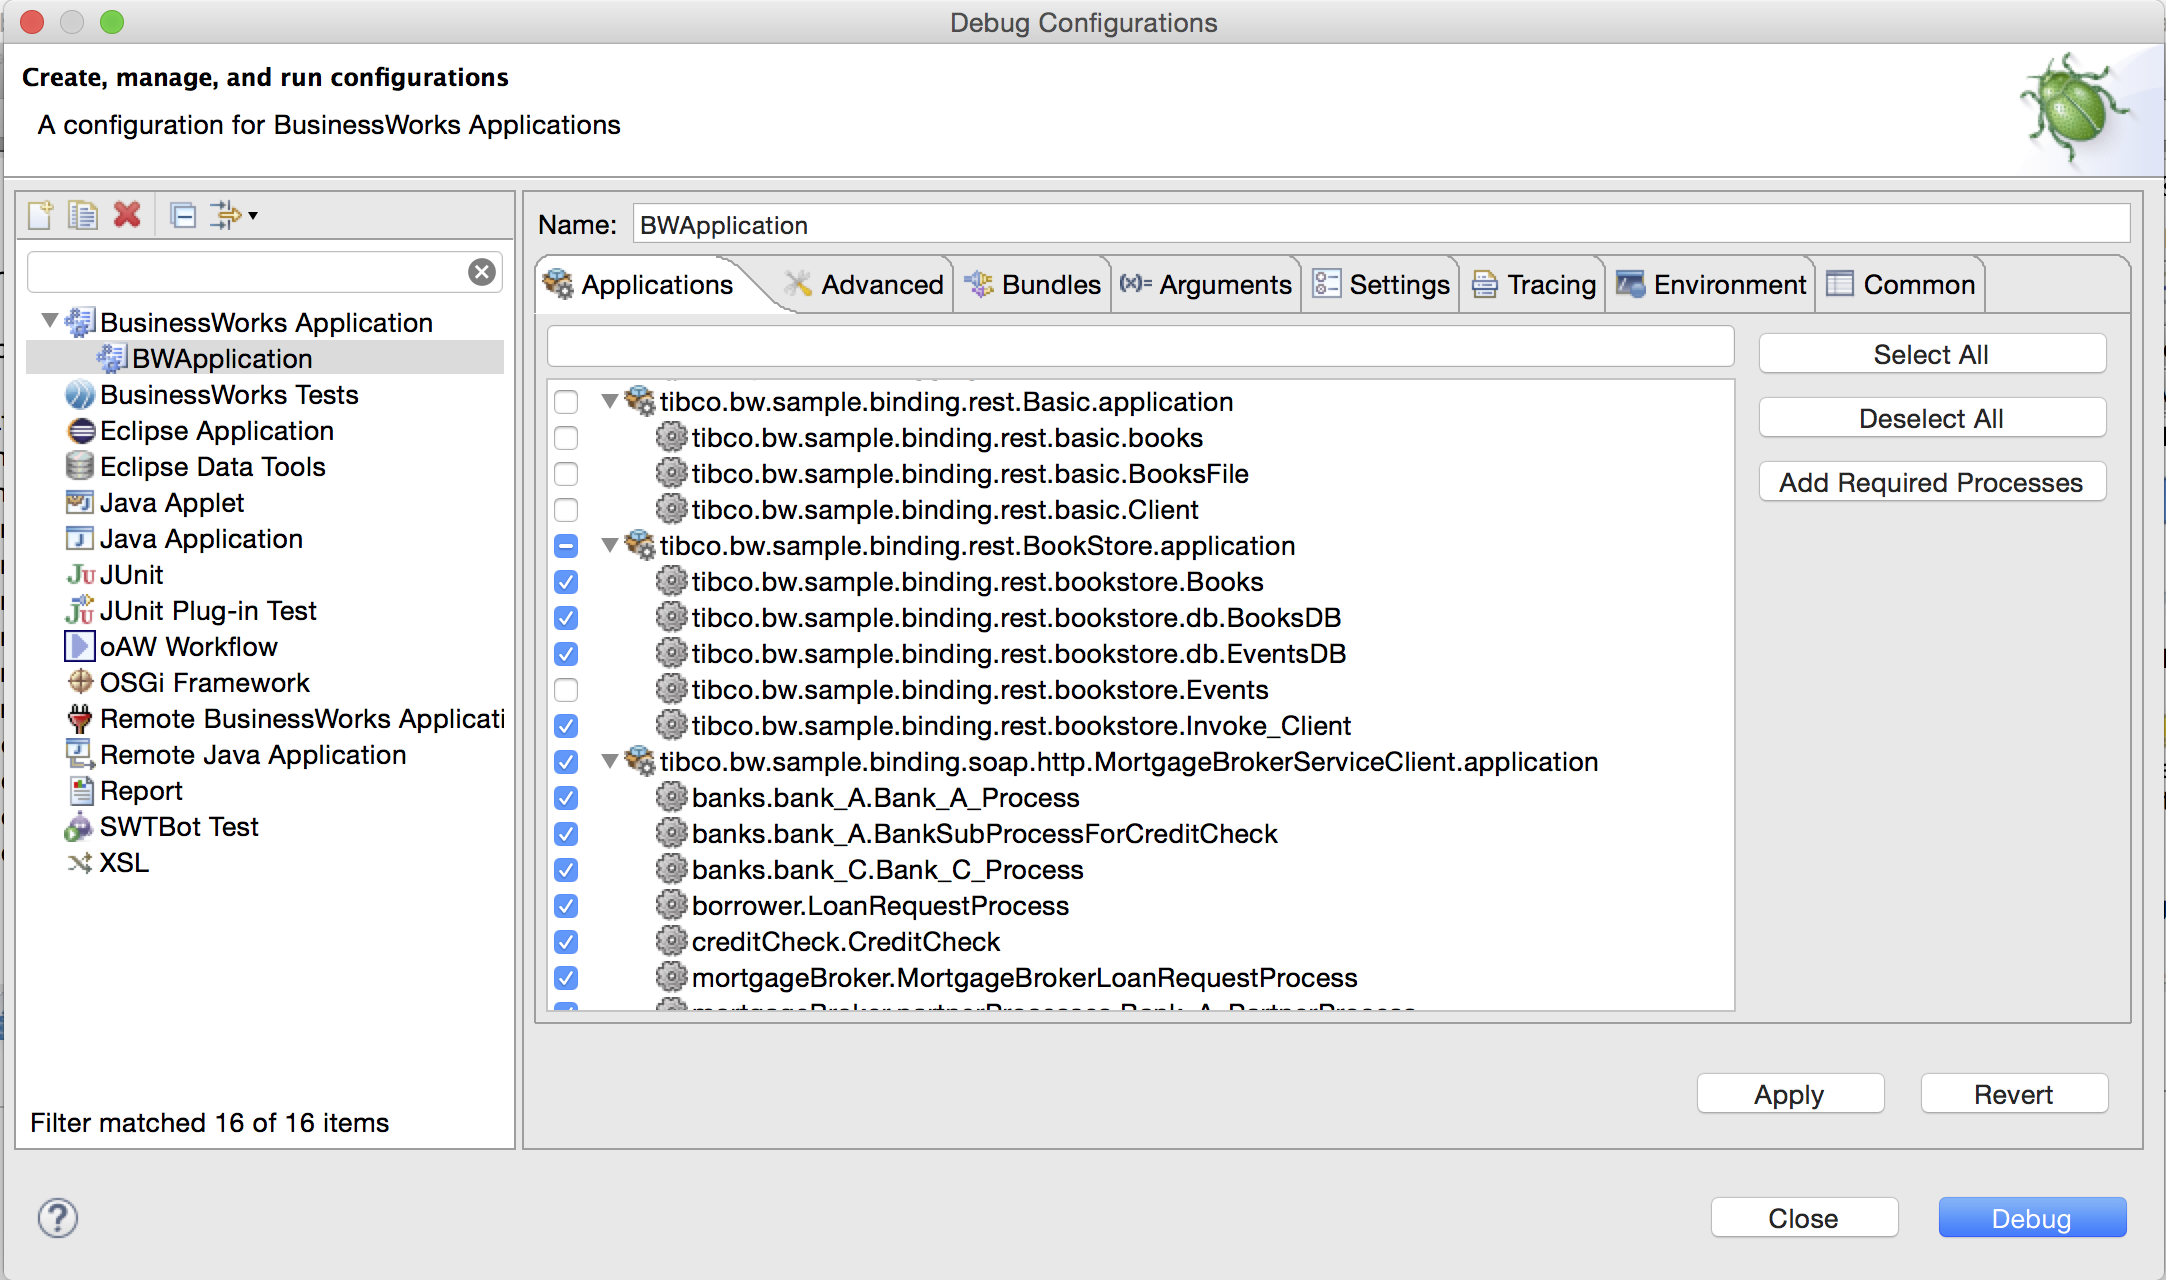
The Debug perspective consists of set of views which are related to the debugging task. Some views, for example the Project Explorer view, are not available in the Debug perspective, while others, such as Debug and Breakpoints, are available in the Debug perspective. There are multiple ways to open the Debug perspective:
- From the main menu, select
and then select
 Debug.
- From the
Testing area, click
Launch BusinessWorks Debugger.
The Debug perspective consists of the following views, starting from the upper left corner clockwise:
- Debug: Shows the list of debug launches and allows you to manage them using the icon bar as follows:
- BusinessWorks Jobs: shows all running jobs and allows you some basic management such as, to Clear All Jobs
 .
.
- Servers: shows the servers that are available. You can also define a new server using the New Server Wizard, which allows you to define a new server as well as to download additional server adapters.
- Variables: shows the variables associated with the process being debugged. The main management tasks associated with the variables are:
- Breakpoints: shows the breakpoints used for debugging. The main management tasks associated with the breakpoints are:
- Job Data: shows available information about the running process instances.
- Process Launcher: shows available sub-processes that can be launched. Inputs to the process instance can be provided in the process launcher.
- Properties: shows available information about the properties in the process being debugged.
- Tasks: shows all debugging tasks listed by their resource, path, location, and type.
- Console: gives the output of the debugging task.
 Remove All Terminated Launches
 Resume
 Suspend
 Terminate
 Disconnect
 Step Into, Step Over, Step Return, Drop to Frame
 Use Step Filters
 Show Type Names
 Show Logical Structure
 Show Breakpoints Supported by Selected Target
 Go to File for Breakpoint
 Skip All Breakpoints
 Link with Debug View
 Add Java Exception Breakpoint