Monitoring Threads and Taking a Thread Dump Using JVisualVM
You can use JVisualVM to monitor threads and take thread dumps for an AppNode container.
Procedure
Enable JMX on the
Application Container
by adding the following JMX
property in the docker run or within the yml files for remote monitoring.
BW_JMX_Config environment variable is used to set JMX configuration (RMI host and JMX port) for monitoring the
TIBCO BusinessWorks™ Container Edition application. The value should be provided in
RMI_HOST:JMX_PORT format.
Docker- For docker run, provide the
BW_JMX_CONFIG value as below:
docker run -e BW_JMX_CONFIG="<RMI_Host>:<JMX_Port>" -d
-p <Host_ApplicationPortToExpose>:<Container_ApplicationPort>
-p <Host_JMXPortToExpose>:<Container_JMXPort> <ApplicatonImageName>
Where,
RMI_HOST is the docker host IP
JMX_PORT is the remote JMX connection which gets enabled.
Container_Application port is the end user requests that gets processed.
Container_JMXPort handles the JMX connection request.
Note: Published ports (-p) are exposed ports that are accessible publicly over the internet. These ports are published to the public-facing network interface in which the container is running on the node (host).
Kubernetes- In yml file provide the environment variable entry as
BW_JMX_CONFIG. Please refer the following
manifest.yml file:
Once the application container is running, add the ssh into the container and map the container port to the localhost or node port using the command below:
Host_Port is the port which is available on the host machine.
HostIP is the IP address of the machine from which the JMX connection is being launched.
Container_JMX_Port is the JMX_PORT specified in the BW_JMX_CONFIG while the application is launched.
Start
jvisualvm.exe from the
JDK_HOME/version/bin directory.
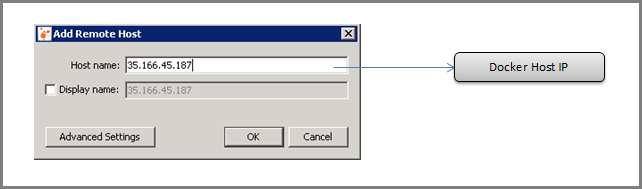
Connect to the application container remotely or by using the
JMX_PORT. To connect remotely, select
Remote in the
Applications tab and right click
Add Remote Host. Enter the remote
Host name field.
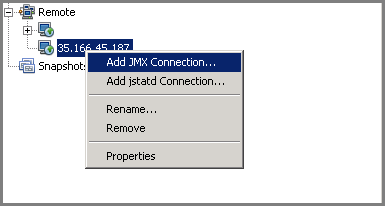
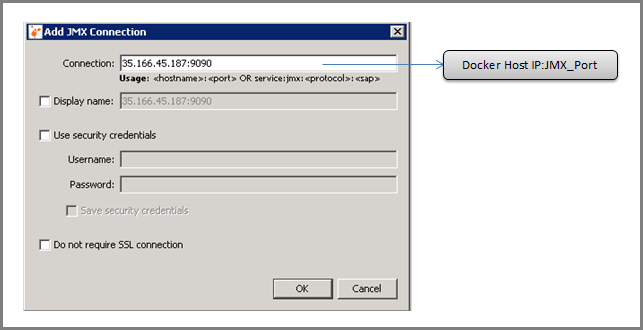
Add JMX connection to the remote host as displayed in the images below.
Right click the remote JMX connection for the Container and select
Open.
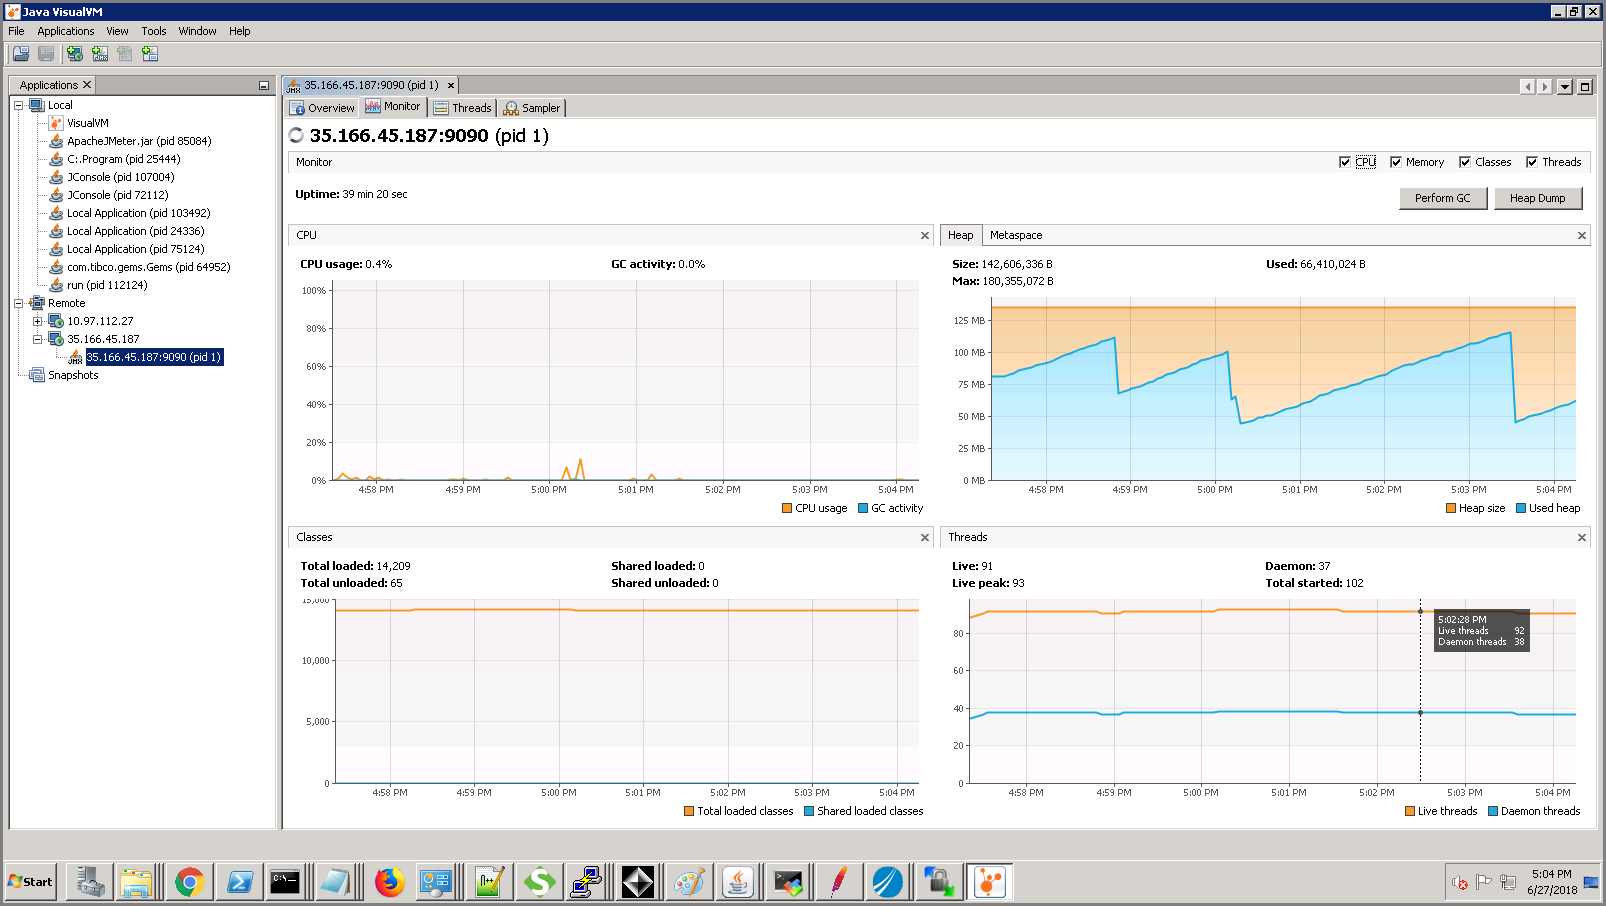
The
AppNode
CPU, memory, classes and threads can be monitored in the
Monitor tab. The memory chart also provides the maximum memory settings of the JVM. You can perform a manual GC and obtain the heap dump too.
The following figure demonstrates the typical heap usage pattern of the AppNode
running inside a container, which is a sawtooth pattern. This sawtooth pattern indicates the normal behaviour of the JVM. For more information, see the
Stack Overflow website. Here the memory usage steadily increases and then drops due to garbage collection.
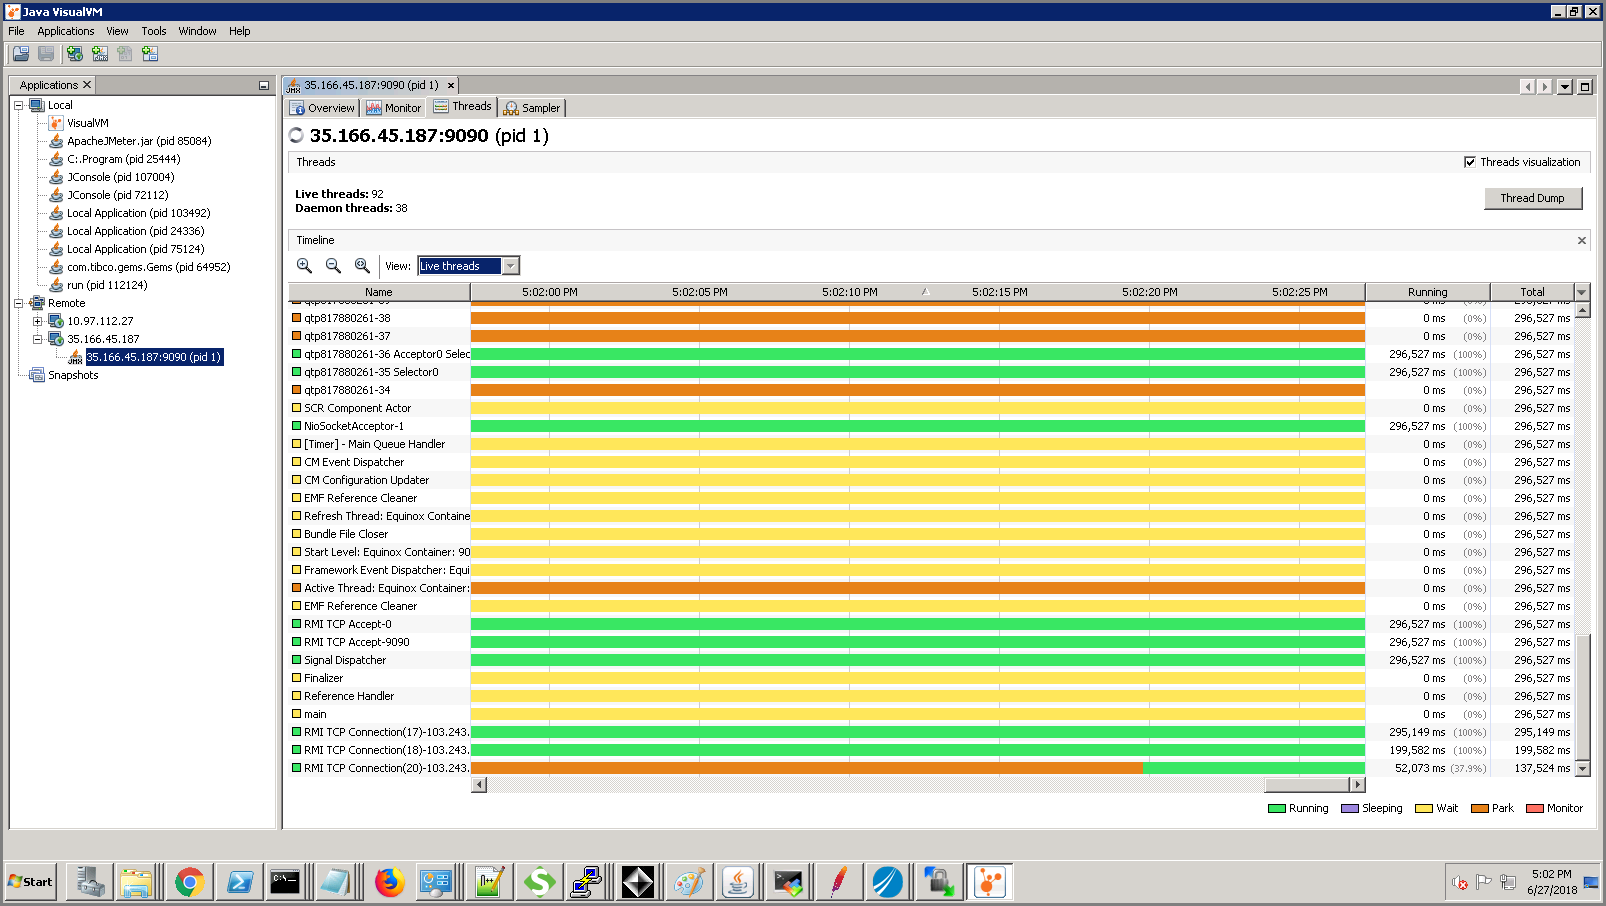
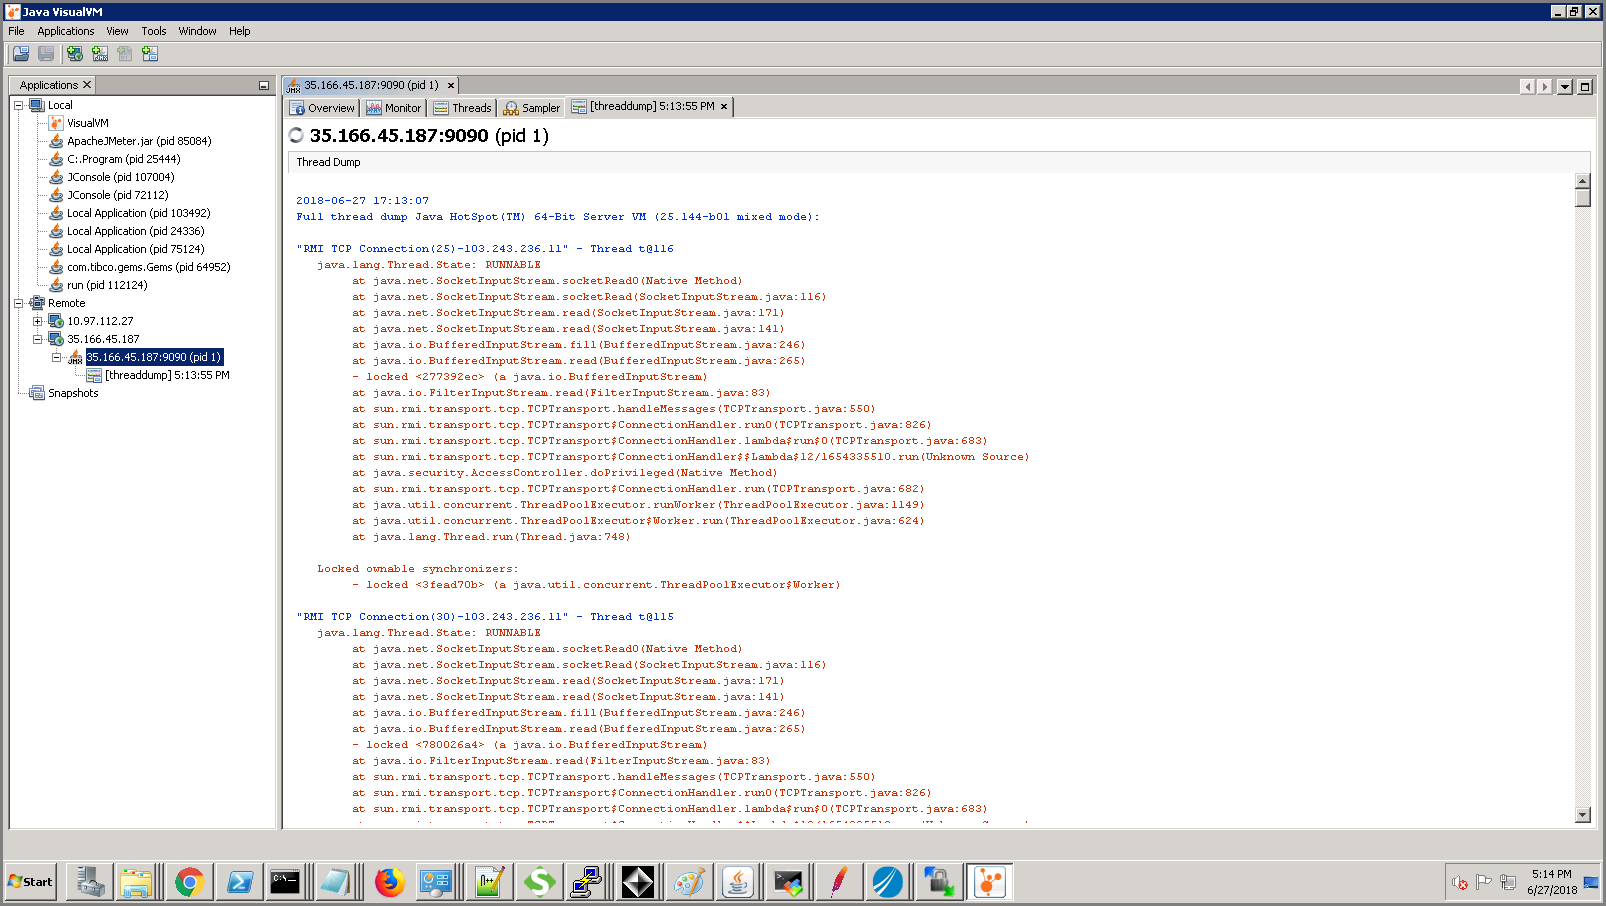
You can monitor the thread states and obtain the thread dump from the
Threads tab.
JVisualVM provides CPU and memory profiling capabilities. By default, the profiling tool is not in a running state until you are ready to profile the application. You can choose from the following profiling options:
CPU Profiling - Select
CPU Profiling to profile and analyze the performance of the application in terms of throughput, scalability or response time.
Memory Profiling - Select
Memory Profiling
to analyze the memory usage of the application. The results display the objects allocated by the application and the class allocating those objects.
When you start a profiling session, JVisualVM attaches to the local or remote AppNode
and starts collecting the profiling data.
When the profiling results are available, they are displayed in the
Profiler
tab.
JVisualVM has the following plugins for java implementation:
A sampling profiler - Statistical and light weight
An instrumental profiler - Heavier
Note: CPU and memory usage in the
Monitor tab are for BW Application running inside a container. In actual scenario we may need to set the container memory greater than the JVM heap size.