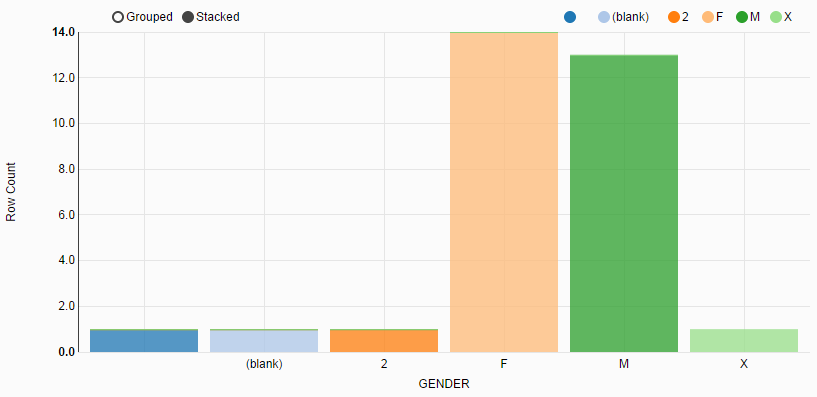
JavaScript must be enabled in order to use this site.Please enable JavaScript in your browser and refresh the page. Creating a Bar Chart to Check Invalid Data Create a bar chart to check invalid data. To create a bar chart to check invalid data in the GENDER column: Procedure On the toolbar, click Chart. In the Chart type area, click bar, and then configure the chart setting: From the X axis list, select GENDER. From the Y axis list, select Row Count. From the Group by list, select GENDER. Click Create chart. A bar chart is created. On the top of the chart, click stacked. Result A bar chart is created. The chart shows that the GENDER column has invalid values: (blank), 2, and X. Copyright © Cloud Software Group, Inc. All rights reserved.