Profiling Validating Results

After validating data, you can profile the validating results.

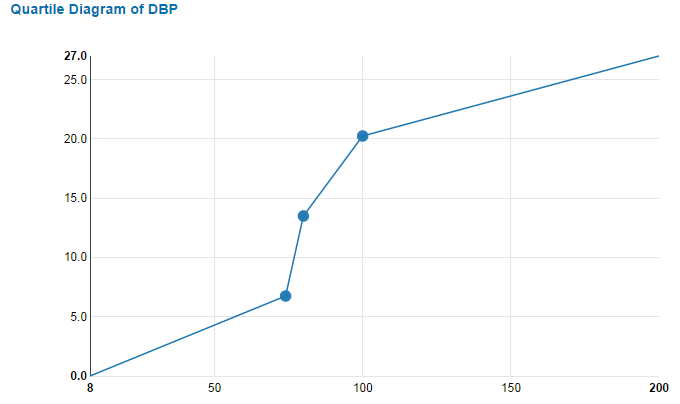
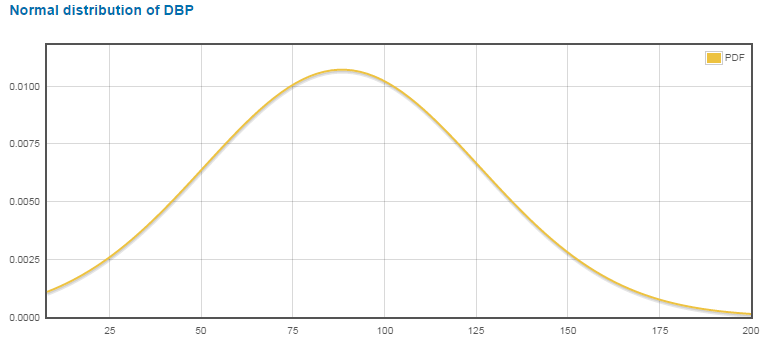
In this example, column analysis is used to profile the validating results. You can analyze a specific column by using a quartile diagram or a normal distribution diagram.

Procedure

  1. On the toolbar, click Profile.
    The "Profiling analysis" page is displayed.
  2. From the Analysis type list, select Column analysis.
    The column analysis report of the validating results is generated.

  3. Analyze a specific column by using a quartile diagram or a normal distribution diagram.
    • Using a quartile diagram:
    1. Click any value in the following columns: 1st quartile, Median, or 3rd quartile. For example, click the 1st quartile value of DBP.
      A quartile diagram is generated.

    2. Click Close to exit.
    • Using a normal distribution diagram:
    1. Click the Std deviation value for DBP.
      A normal distribution diagram is generated.

    2. Click Close to exit.