Using the add-on
Entering the Graph View
Once you register a table with the add-on, you can execute services to display the table, or the data it contains, in the Graph View. After the graph loads you can execute data queries, have one-click data access, and can perform other actions specific to the Graph View.
The following table lists procedures to enter the Graph View and their expected outcomes:
Expected Outcome | Procedure |
|---|---|
Display a graph showing the data values of selected records. Note: You can determine whether users can view data values at the graph configuration level. See the information contained in 'Configuring the add-on' for information on configuration options. | To execute the 'Display the selected data value' service on a table:
|
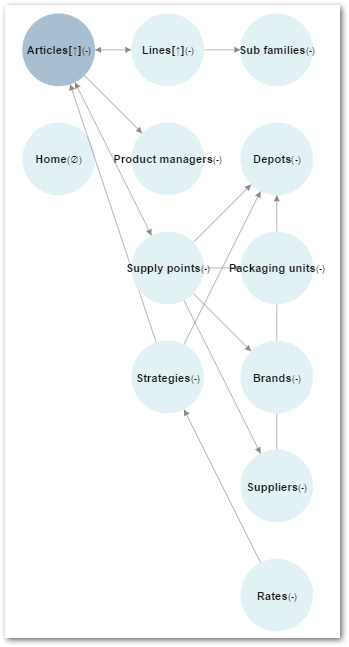
Display the table and its related tables in the Graph View. The table becomes the root node in the context of this graph. The following describes the behavior based on record selection:
| To execute the 'Display data structure' service on a table:
|
Display graph nodes in a hierarchy based on recursive relationships, or simple join tables. To access this option from a table's menu, you must enable it at the graph configuration level. See 'Directly accessing hierarchy display from tables' for more information. | To execute the 'Display recursive hierarchy' service:
|
Querying and accessing data
Once the Graph View is open, you can run data queries and access data returned by queries. The following example shows how to query an unresolved node and view table records in the Graph View. You can run queries using these same steps on a resolved node. To execute a query:
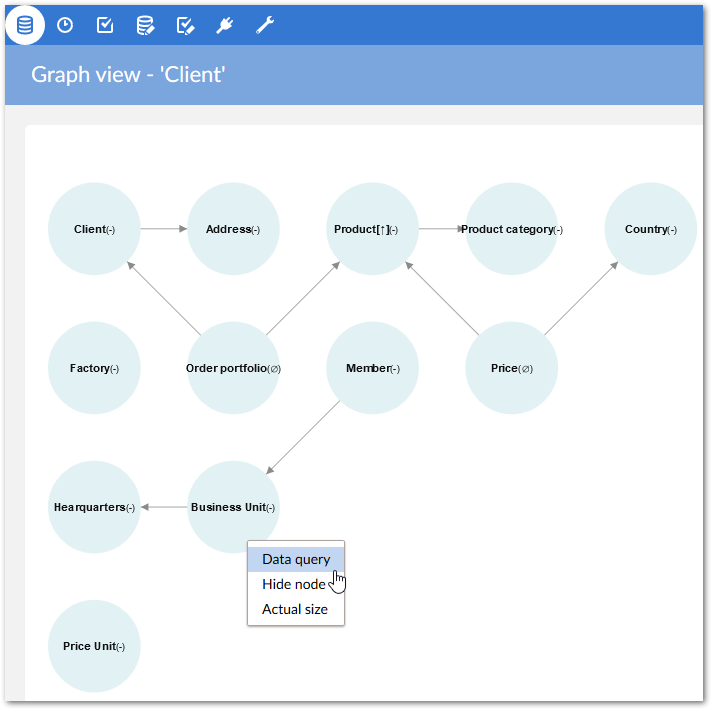
Left-click the desired node and select 'Data query'. The node's corresponding table displays.
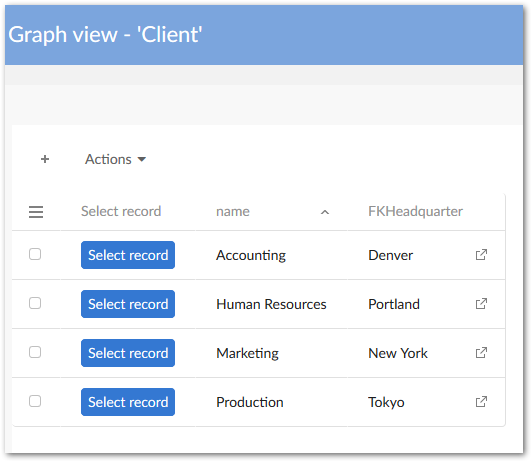
Select one or all records in the table for the query. For this example, we'll use our favorite client 'Peter'. Because we are only using a single record, we'll perform a quick select by clicking the 'Select record' button. Alternatively, you can use the checkboxes to select multiple records and run the 'Select record(s)' service from the 'Services' menu. Note: to assist in graph performance you can limit the maximum number of selectable records using the 'Max. Number of selectable records' property. If the number of selected records exceeds this threshold, an error message displays. See 'Graph' table section for a description of this property.
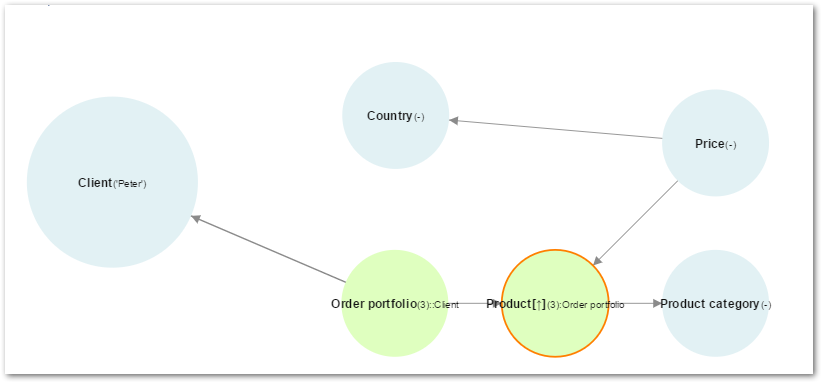
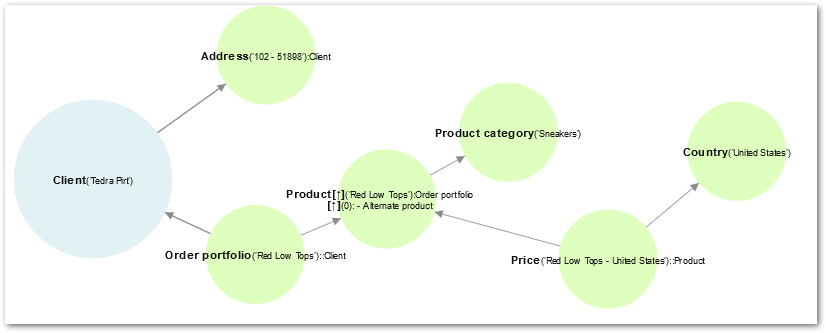
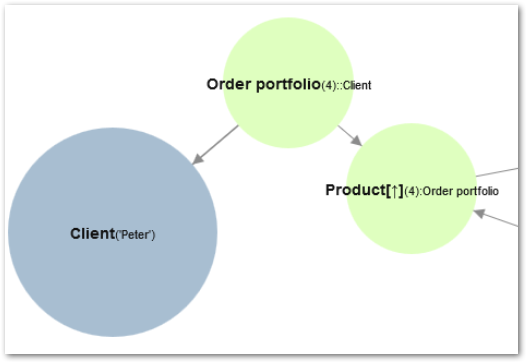
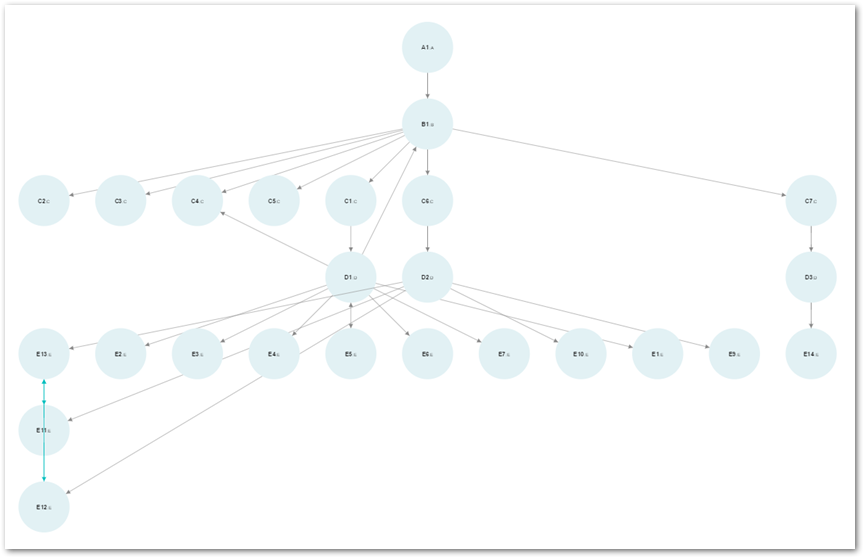
Notice that node layout has changed to indicate which nodes have resolved and the last queried node displays larger than the others. This also helps identify the context of the graph. From the graph layout we can determine that a query was initiated from the 'Client' table using the 'Peter' record. The resolution reached as far as the 'Product' table. See the 'Query continuation' section for information on continuing resolutions. You can use the settings in the 'TIBCO EBX® Graph View Add-on configuration' → 'Reference data' → 'Node layout' table to alter display of each node type: standard node, resolved node and root node.
After a node has been resolved, the label displays the corresponding table's record. If the table contains more than one resolved record, the number in parenthesis indicates the number of resolved records in the table. Keep in mind that this is the number of resolved records or records in this context, and may not be the total number of records in the table. For example, the above node label Product[↑](3): Order portfolio indicates that the product table has three records. The Graph View makes accessing these records easy-see the next step.
Left-click a resolved node and select the desired value. For this example we selected the 'Product' node.

Selecting 'Display graph data value' opens another graph that shows the data values, or table records, for current graph context. This graph only shows as far as the currently executed query (really the graph context). Note: If the number of records is large, the limit set by the 'NbMaxNodeDisplay' property may be exceeded and node display per page may be limited. You can left-click on a node and select the 'Display graph from current node' service to page through the remaining records.
Query continuation
In the previous example, the query stopped at the 'Product' table. As shown in the corresponding image, an orange circle borders that node. This border indicates availability of the 'Continue data query' service. This service allows you to continue a query without resetting the graph's context and subsequently changing data values. You can customize the continuation node's border color used in each graph configuration.
To continue a query:
Left-click on the highlighted node where the previous query stopped. In our example this is the 'Product' node.
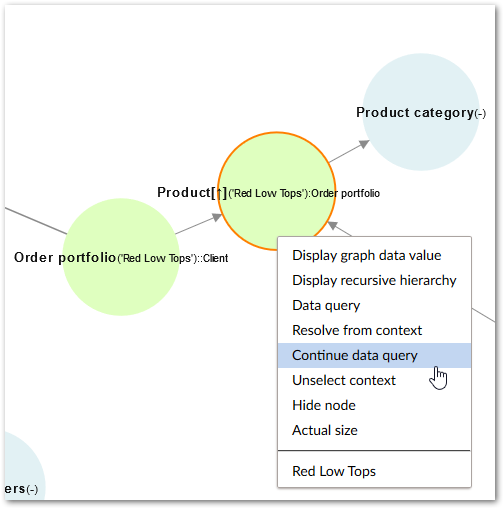
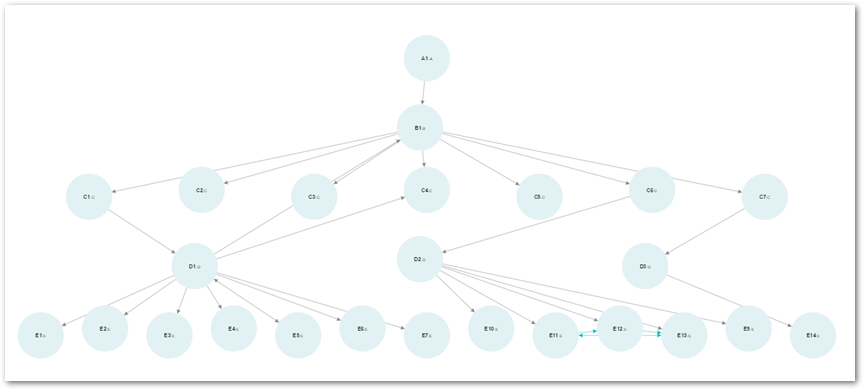
Select 'Continue data query'. The image below shows the result.
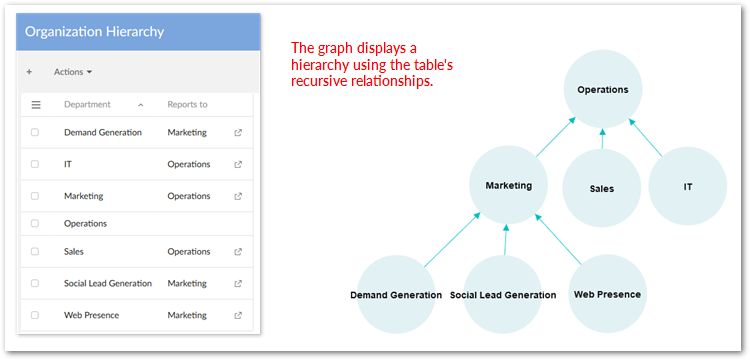
Displaying data as hierarchies
The Graph View can display data value nodes in a hierarchy when data structures include:
Self-referencing foreign keys (recursive relationships)
Foreign key relationships
Simple Join tables (multiple foreign keys from a source table to a target)
Self-referencing foreign key hierarchies
A self-referencing foreign key, or recursive relationship occurs when a foreign key references its containing table. In these instances, the Graph View creates a hierarchy of the table's data values based on the following guidelines:
Top level (parent) node: This node has the most nodes referencing it, or it does not refer to any other nodes.
Sub-level (child) nodes: The Graph View follows the relationships to create the child levels. The first level of child nodes all directly reference the top level node. Each subsequent child level holds a relationship to a node in the level above it.
The following image shows an example of a hierarchy based on recursive relationships shown in the table:
To show a hierarchy based on a recursive relationship:
Run the 'Display recursive hierarchy' service located in one the following locations:
At the table level. From a table's 'Actions' menu, select 'Graph View' → 'Display recursive hierarchy'. Before running this service at the table level, you need to enable it via the table's configuration. See the section below, 'Directly accessing hierarchy display from tables', for more information.
At the node level. While viewing a graph, you can left-click on nodes that have recursive relationships (indicated by the [↑] symbol) and select 'Display recursive hierarchy'.
After running the service, a list of recursive relationships contained in the table displays. Select which relationship (if more than one recursive relationship exists) to base the hierarchy on.
Decide if you want to qualify the relationships shown in the graph by displaying values from a selected field on the transitions between nodes. If you do want to use a qualifying field, check the 'Field used to qualify the relationship' box and click the desired field's radio button.
You can check 'Save for reuse' to retain the selected options. When satisfied with the configuration, click 'Submit'.
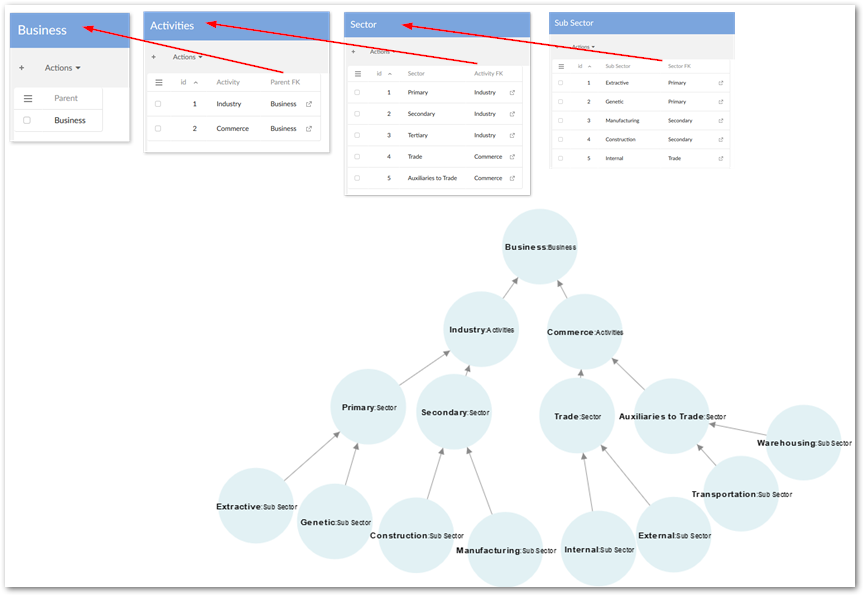
Hierarchical node arrangement based on foreign keys
A hierarchical arrangement of data value nodes based on foreign keys—when no recursive relationships exist—puts root table records at the topmost hierarchy level. The Graph View considers the table from which you ran the 'Display graph data value' service as the root table. Following the foreign key relationships between tables, each subsequent node level includes nodes from the child tables. As with the orientation options for graphs showing data values, each hierarchy row contains nodes from the same table.
You can display a data value node hierarchy using the following methods:
Manually: When viewing a graph of data values, from the 'Services' menu, select 'Arrange nodes' → 'In a hierarchy'.
Automatically: Open the desired graph configuration's 'Data value graph' tab and set the 'Default node orientation' property to 'Hierarchy'. For more information on default node orientations, see the 'Changing default node orientation' section.
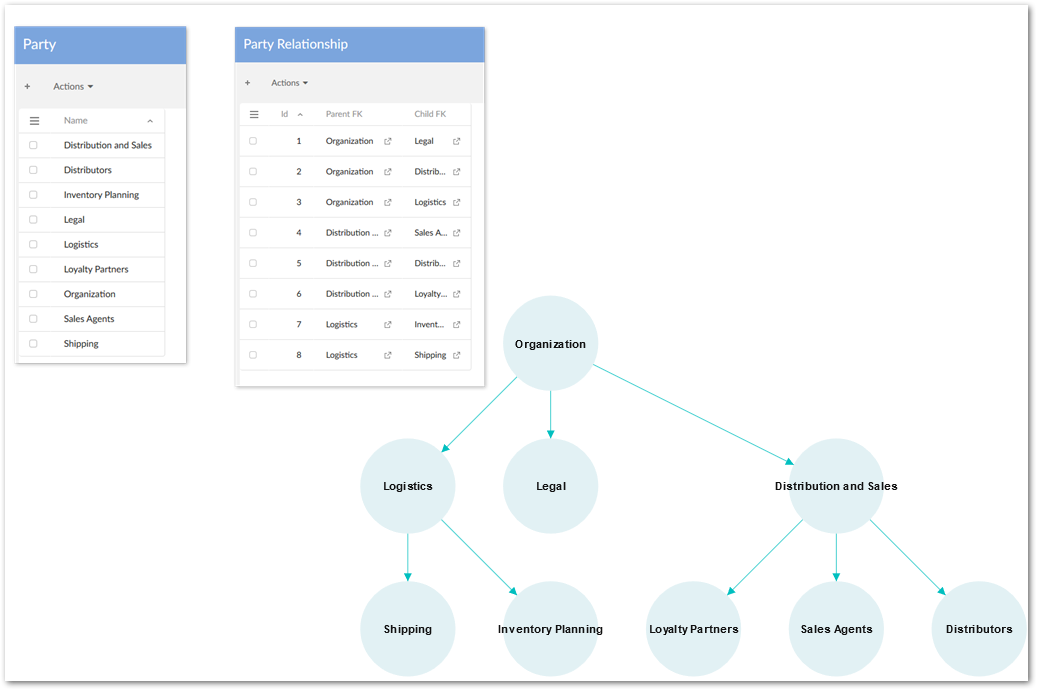
Hierarchies from simple join tables
Your data structure contains a simple join table when a source table holds multiple foreign keys that refer to the same target table. The Graph View allows you to select one of these relationships and generates a hierarchical view of the corresponding data values.
The following image shows a graph based on the 'Relation Party' table's 'Parent' and 'Child' fields which hold foreign keys to the 'Party' table.
To render a graph showing values from simple join tables as a hierarchy:
Run the 'Display recursive hierarchy' service located in one the following locations:
At the table level. From a table's 'Actions' menu, select 'Graph View' → 'Display recursive hierarchy'. Before running this service at the table level, you need to enable it via the table's configuration. See the section below, 'Enabling hierarchy access at the table level', for more information.
At the node level. While viewing a graph, you can left-click on nodes that have recursive relationships and select 'Display recursive hierarchy'.
After running the service, a list of foreign key relationships contained in the table displays. Select which relationship (if more than one exists) to base the hierarchy on. The records that belong to the foreign key you select display as the parent of the remaining foreign keys.
Decide if you want to use an additional field to qualify the relationship. When you choose a field here, node transition labels display the field's values that correspond to each relationship. If you want to display this information, select the check box. A list of all fields in the table displays. Select the radio button corresponding to the desired field.
You can check 'Save for reuse' to retain the selected options. When satisfied with the configuration, click 'Submit'.
Directly accessing hierarchy display from tables
The 'Display recursive hierarchy' service does not automatically show in the Graph View sub-menu for all tables registered with the add-on. A table must have a recursive or a simple join relationship to display as a hierarchy in the Graph View. And, you must make the Graph View check to determine that these types of relationships exist. Use the following instructions to have the Graph View check for these relationships (you should perform this action after updates to the data model that may affect these relationships):
Navigate to 'Administration' → 'TIBCO EBX® Graph View Add-on configuration' → 'Graph configuration' → 'Table' and select the check box corresponding to the table configuration.
From the 'Actions' menu's 'Services' group, select 'Update hierarchy view'.
After running the service, a confirmation screen displays a list of tables checked by the service. A value of 'Yes' in the 'Result' column indicates the table met the requirements and you can run the 'Display recursive hierarchy' from its 'Actions' menu.
When the data model changes, you have to run this service again to get the update accordingly.
Understanding node labels and symbols
Each node label conveys specific information about that node, such as how many records its corresponding table contains, whether there are reflexive relationships, whether it has undergone resolution and the resolution direction.
In reference to the below illustration, the following examples translate two node labels:
The 'Product' node label — shows the table contains '(4)' records and ': Order portfolio' indicates that resolution has occurred in a forward direction (forward resolution) through the path indicated by the node label: 'Product' > 'Order Portfolio'. Note: this is the number of resolved records, and may not be the total number of records in the table.
The 'Order portfolio' node label — shows that the table contains '(4)' records and ' :: Client' indicates that resolution has occurred in a reverse direction (backwards resolution) through the path indicated by the node label: 'Order portfolio' > 'Client'.
The 'Product' node label — contains the symbol [↑]. This symbol indicates the node contains a recursive relationship.
If a node has the (→) symbol, it indicates the node has a relationship that isn't displayed. Using the 'Display graph from current node' service, allows you to view the hidden nodes.
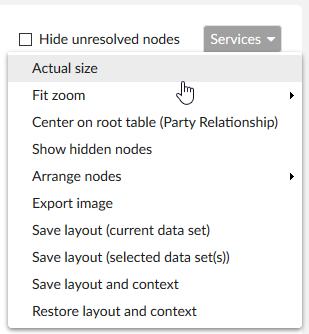
'Services' menu
When in the Graph View the 'Services' drop-down menu contains a list of executable services that can be very useful. Please, see the reference section's 'Services' menu for more information regarding each service.
Optimizing node display
At times, you may want to temporarily hide nodes that don't provide additional value and only serve to clutter your graph. Other times, you could more readily read and understand a graph if its nodes displayed differently. To meet these challenges, the Graph View allows you to hide nodes and change a graph's display orientation. The following sections describe how to work with these options:
Showing and hiding nodes
Expanding and collapsing nodes
Specifying graph display modes
Changing default node orientation
Configuring default grid display
Showing and hiding nodes
The Graph View provides the following two ways to hide standard nodes:
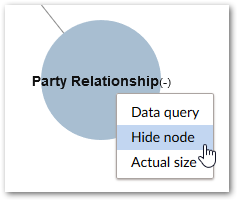
You can hide nodes individually, by clicking on the desired node and selecting 'Hide node'. Graph configuration options allow you to enable, or disable this functionality using the 'Display 'Hide node' service'.
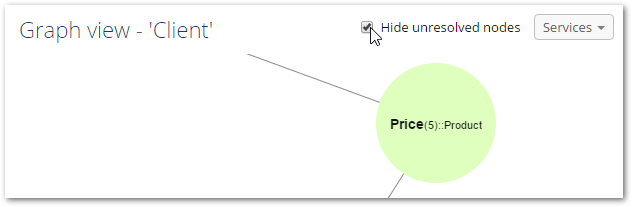
You can hide all unresolved nodes in a graph by selecting the 'Hide unresolved nodes' check box next to the 'Services' menu. At the graph configuration level, you can auto-enable this feature causing the Graph View to automatically hide unresolved nodes after you perform a query.
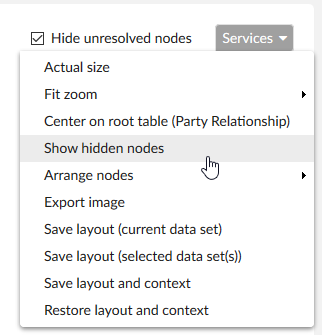
At anytime, you can open a graph's 'Services' menu and select 'Show hidden nodes' to reveal previously hidden nodes. It does not matter what methods you used to hide nodes; running this service displays all hidden nodes.
Expanding and collapsing nodes
When viewing a graph that displays recursive relationships, you can expand and collapse nodes to view/hide related nodes. Administrators can configure display behavior that affects the number of nodes that display at any one time by:
determining the total number of nodes a graph can display. The 'Max. Nb. Of displayed nodes' property, located in a 'Graph' and 'Graph template' configuration, sets this limit.
specifying how many nodes display when the graph initially loads and limiting the number of nodes that display when a user expands a node. The 'Limit initial and expanded node display' property, located in a 'Graph' and 'Graph template' configuration, determines these limits. When users expand nodes, the nodes display according to the selected graph orientation. See the Changing default node orientation section for more information on setting the orientation. When the graph orientation is set to:
Square, Default grid — expanded nodes display in randomly placed positions. You can run the arrange service to match the current orientation, or choose a different node arrangement.
Center aligned hierarchy — nodes automatically re-arrange to accommodate the expanded nodes.
Horizontal, Vertical and Hierarchy — expanded nodes are automatically oriented according to the current arrangement settings.
The expand/collapse options are only available for data values in a recursive hierarchy. See the Showing and hiding nodes section for options in other types of graphs. To expand a node and view related nodes:
Left-click a node that has collapsed related nodes. Underneath the node's label, a number inside of parenthesis (< 6) indicates there are collapsed nodes.
Select 'Expand nodes'. The number of nodes that display depends on this graph's configuration. For example, a node may have five collapsed related nodes. However, if the 'Limit initial and expanded node display' property is set to '4', only four of the five nodes will expand. You can run the service again to expand the fifth node.
You can collapse any node that has displayed related nodes. When you click a node and select 'Collapse nodes', all nodes that have forward transitions from the selected node and any node related to these forward nodes collapses. If at anytime you would like to display all available nodes, select 'Show hidden nodes' from the 'Services' menu.
Specifying graph display modes
Some of your graphs may only have a few nodes while others have a plethora. Upon opening a graph containing many nodes, some nodes can render outside of the graph display area. When this occurs, you have to either zoom out or drag the graph to see these nodes. On the other hand, if a graph with few nodes opens to a distant zoom you might have to zoom in to read labels and symbols. To improve your viewing experience, the Graph View allows you to specify a default display mode for a graph configuration and change the display mode while viewing a graph.
To specify a default display mode used by a graph configuration:
Navigate to 'Administration' → 'User interface' → 'TIBCO EBX® Graph View Add-on configuration'.
Determine whether you want to set this behavior in a template, or override an existing graph configuration and select the appropriate 'Graph', or 'Graph template' configuration.
Locate the 'Default display mode' property and choose from:
Actual size (default value): Displays the nodes at their physical size.
Fit zoom to height: Adjusts the zoom level so that no nodes are located above or below the graph viewing area.
Fit zoom to width: Adjust the zoom level so that no nodes are located outside of the viewing area's horizontal axis.
Fit zoom to window: Adjusts the zoom level so that all nodes display in the viewing area.
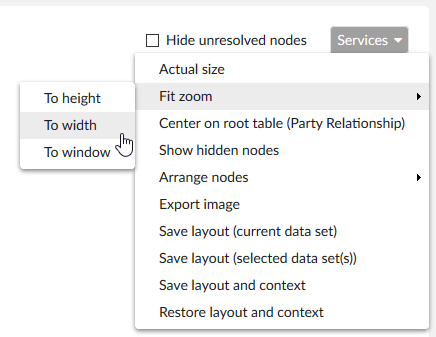
To specify a display mode while viewing a graph, choose from the following options located under the 'Services' menu:
'Actual size': All nodes display at their physical size (default value). If the graph's default display mode is 'Fit to window', clicking 'Actual size' centers the selected node in the window and zooms in. This prevents you from losing your place while studying a large graph and having to zoom in/out.
'Fit zoom': The graph automatically zooms out so that all nodes display according to window height, width or both using the options 'To height', 'To width', or 'To window', respectively.
Changing default node orientation
The Graph View optimizes node display by arranging nodes in a grid. This functionality applies to graphs showing data structure and graphs showing data values. You can use the following layouts:
Hierarchy: You can only choose this option for graphs displaying data values. All nodes from the same table display in one row, or level. The uppermost level contains the records from the table you ran the 'Display graph data value' service, or the root table. When you display data values as a hierarchy, the 'Max. node (horizontally)' property no longer applies and some nodes may render off screen.
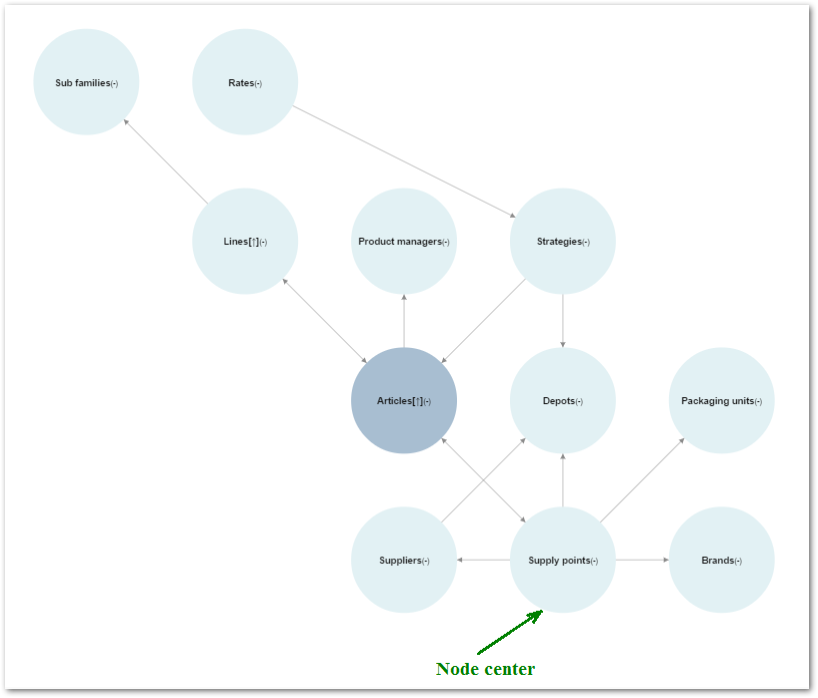
Center aligned hierarchy: You can only choose this option for graphs that show data values. This orientation aligns nodes differently depending on your data structure. Generally speaking, this type of hierarchy arrangement displays a more horizontally oriented graph than a traditional vertical hierarchy.
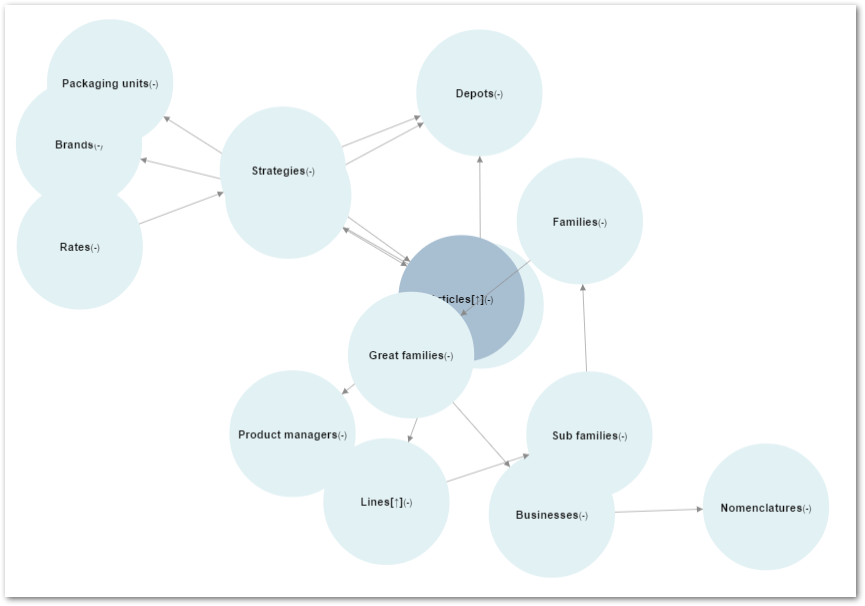
Square (default layout for data structure graphs): the node with the most relationships displays in the center. Subsequent levels in the grid—working outward from the center—contain related nodes. The first square around the center node contains nodes related to the node in the center. The next square out contains nodes related to nodes in the first square, and so on.
Horizontal: the root node and any nodes without relationships display in the top row. With this type of orientation, graphs will generally be wider and shorter.
Vertical: the root node and any nodes without relationships display in the top row. With this type of orientation, graphs will generally be taller and more narrow.
Default grid: only available in graphs displaying data values. Each row contains data value nodes from the same table.
Random display: only available in graph structures.
You can determine the preferred layout using default configuration settings, or by selecting an alternative option from a graph's 'Services' dropdown menu. See the 'Configure default grid display' section below for information on setting the default layout. Examples of each display option are shown in the following images.
Horizontal display:
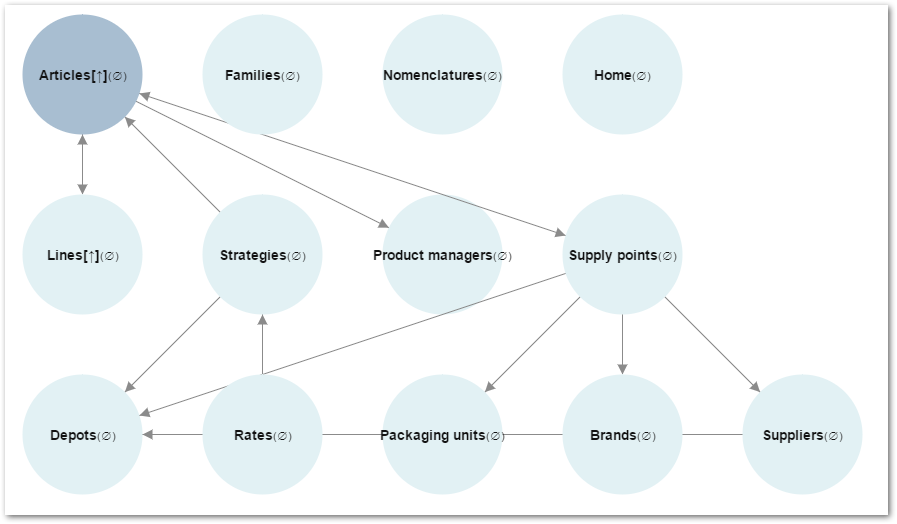
Square display:
Vertical display:
Random display:
Center aligned hierarchy:
In a hierarchy:
Configuring default grid display
By default, grid orientation is square for data structure graphs, and center aligned hierarchy for data value graphs. The following steps show how to change default grid layout:
Navigate to: 'Administration' tab → 'TIBCO EBX® Graph View Add-on configuration' domain → 'Graph configuration' → 'Graph', or 'Graph template'.
Open the graph configuration that you want to modify.
You can set default display for the following:
Graphs showing your data structure: On the home tab, locate the 'Default grid orientation' property and select one of the available options: 'Horizontal', 'Square', 'Vertical', or 'Random display'.
Graphs showing data values: On the 'Data value graph' tab, locate the 'Default node orientation', 'Default recursive node orientation' or 'Default custom graph node orientation' properties and select one of the available options: 'Horizontal', 'Square', 'Vertical', 'Center aligned hierarchy', 'Hierarchy' or 'Default grid'.
Save and close to finish your modification.