Creating a custom view
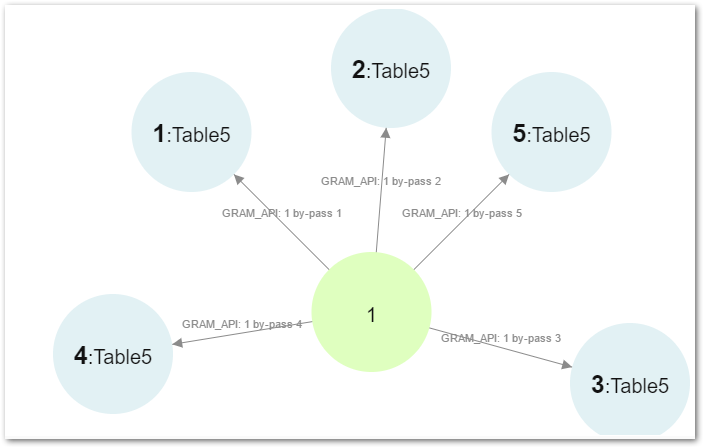
You can implement a customized graphical view of your data using the API. After creating a Java class, you can add it to a graph configuration in the 'Graph' table. Each graph configuration can have multiple Java classes. When you enter the Graph View, you can select one custom implementation to display your data. For more information, see the API documentation.
The following outlines the steps to take after creating your custom classes:
Navigate to the 'Administration' → 'TIBCO EBX® Graph View Add-on configuration' → 'Graph configuration' → 'Graph' table.
Open the graph configuration to which you want to add your custom classes and click on its 'Custom data value graph' tab.
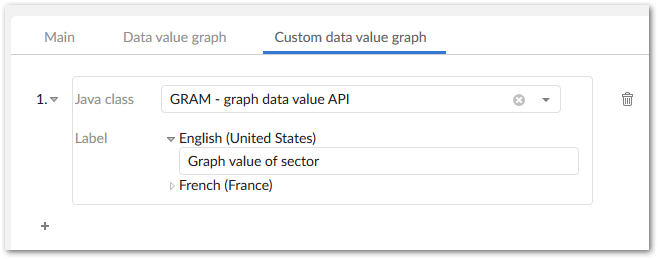
Click the '+' icon to add a class and select the desired class from the 'Java class' drop-down list. In addition, you can add a label and define it in multiple languages. Repeat this step for any additional classes you want to add.
Save and close. When you run the 'Graph View' service from a table the 'Custom data value graph' now displays as an option. After selecting this option, you can choose one of the classes you added and generate the graph.