Using data value graphs
When you generate a data value graph using default functionality—a graph not tied to a custom configuration—the add-on displays the selected values as nodes. From the graph, you can:
Export a PDF, PNG, or SVG of the graph.
Change the node shape.
Expand the graph to fullscreen, zoom to change the magnification level.
Click and drag a node to change its position or graph background to change its orientation.
Expand/collapse nodes and view node details. To view node details, double-click a node.
Filter the graph content to display only the data and relationships you want.
Use the Overview mini-map to re-orient the graph. Additionally, you can move the box to a different corner of the graph by selecting its title bar and dragging.
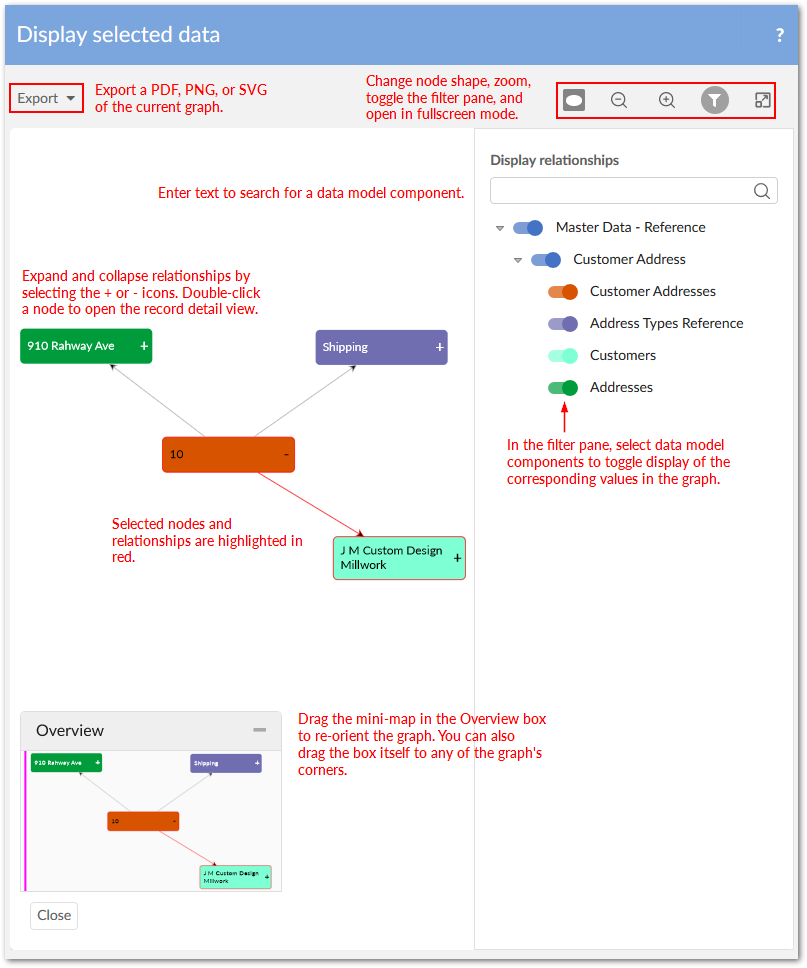
The following image highlights the available features when viewing a data value graph: