Configuration information
Monitoring overview
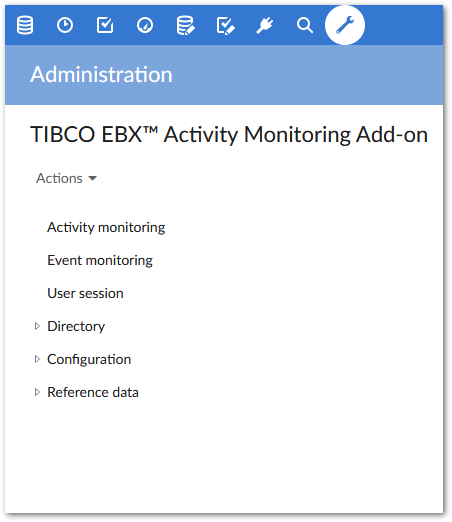
In the EBX® 'Administration' area, you'll find the following tables and domains that contain configuration options and store monitoring data.
The 'Activity Monitoring' table collects all the data related to the execution of operations.
The 'Event monitoring' table stores records pertaining to user log in and log off events.
The 'User session' table keeps track of information about each unique user session.
The 'Directory' domain allows you to register the operations that you want to monitor.
The 'Configuration' domain allows you to configure tracking for user log in and log off activity.
Each table in the 'Reference data' domain stores reference data used by the add-on.
Activity Monitoring table
The 'Activity Monitoring' table records all data collected by the monitor during communication with operations. Color coding applied to the 'Status' property is used to display it contextually depending on the operation execution status. By default, all data for the monitor is read-only.
Property | Definition |
|---|---|
Operation | The operation for which the log is recorded. |
Creation date | The date when the log record was created. |
Business ID | Any value can be provided by the operation. This identifier is used to group the monitoring records by business concept. For instance, if the 'Business ID' is the unique identifier of a customer, then it becomes possible to group all business activity for this customer in the 'Activity Monitoring' table. |
State | The current state of the operation. The possible values (Started, Stopped and Suspended) are defined in the 'State' table located in the 'Reference data' domain. |
Stop cause | Once an operation is stopped, a stop cause is recorded that shows why the operation has terminated. Possible values (Failure, Kill and Normal) for this property are defined in the 'Stop cause' table located in the 'Reference data' domain. |
Status | Status information highlights whether operations execute normally or in an atypical manner. The possible status values are declared in the 'Status' table located in the 'Reference data' domain. Example values include: 'Default' (normal execution), 'Exceed max. duration time', 'Not yet killed' and 'Stop exceeded max duration'. Color coding for each status value provides a specific visual alert when querying the monitor. These colors can help you distinguish between an operation that stopped normally and one that stopped because it exceeded its maximum allowed duration time. |
Secondary status | When more than one status is raised for a monitoring record at the same time, then the 'Secondary status' property lists these values. This does not show a history of the status values over time, only current status values that have been raised. |
Record | One or more references to a record can be logged by the operation. |
Table | A reference to the table on which the operation is executed. |
Data set | A reference to the data set from which the operation is executed. |
Data space | A reference to the data space from which the operation is executed. |
User requester | The user that initiated operation execution. |
User killer | The user who requested termination of operation execution. |
Start date | The operation's start date. |
Last modification date | The record log's last date of modification. |
End date | The operation's end date. |
Percentage of completion | Completion percentage of the operation execution. |
Last suspended time | The last time operation execution was in a 'Suspended' (pending) state. |
Last restart time | The last operation execution restart date if the operation was previously suspended. |
Total duration in minutes | Total operation execution time. This duration is automatically computed by the monitor every time the operation refreshes its status. |
Max duration in minutes | An operation can be associated with a maximum expected execution duration. When the operation is registered in the directory, its 'Max. duration in minutes' property can provide a default value. During the execution, the operation can override this value when starting its communication with the monitor. |
End code | This property is used by the operation to record an 'end code'. This value is not used by the monitor. This is for information purposes only. |
Wait to be killed | The 'Wait to be killed' property allows the monitor to inform the operation whether its termination is expected or not. 'True': The operation is informed that it must stop as soon as possible. 'False': The operation can continue its execution. |
Input parameters | The operation can record any business data in the monitor with the data format 'Name-Value' (multi-occurrence). Three types of data are identified: input parameters, working parameters and output parameters. |
Working parameters | The operation can record any business data in the monitor with the data format 'Name-Value' (multi-occurrence). Three types of data are identified: input parameters, working parameters and output parameters. |
Output parameters | The operation can record any business data in the monitor with the data format 'Name-Value' (multi-occurrence). Three types of data are identified: input parameters, working parameters and output parameters. |
Event monitoring table
This table stores all records that correspond to a user's log in and log off activity. You can set a limit on the number of records this tables stores. See the 'Configuration' → 'Global' table for more details.
Property | Definition |
|---|---|
Code | A unique identifier generated by the add-on. |
Event | The operation that triggered event storage. The 'Event' table stores the color coded events that can display here. |
User session | Information about each user session, including the User ID, Session ID and IP address. This field references records stored in the 'User session' table. |
Event time | The timestamp of the corresponding event's execution. |
Duration | The amount of time accrued by the corresponding operation. The add-on calculates duration by subtracting the log in timestamp from the log out timestamp. If no log in was recorded for a user's session, the add-on cannot compute the duration. |
User session table
This table stores information pertaining to each unique user session.
Property | Definition |
|---|---|
User id | The user ID corresponding that initiated this session. |
HTTP session id | The unique session ID. |
IP address | The user's IP address. |
Directory
The 'Directory' group allows you to register the operations that can be monitored. They are declared by products (EBX® 'modules').
Product
A product is an EBX® module that contains the operations that are registered.
Property | Definition |
|---|---|
Code | Technical name of the EBX® module. Example: ebx-addon-dqid, ebx-addon-daqa. |
Name | Functional 'name' of the EBX® module. Example: TIBCO EBX® Insight Add-on or TIBCO EBX® Match and Cleanse Add-on. |
Description | Any description can be entered for the module. |
Operation
This table contains the operations that are registered to be monitored.
Property | Definition |
|---|---|
Product | A reference to the product that contains the registered operation. |
Operation | Unique name of the 'service' in the EBX® module (product). For example: - "DQIdExecuteAndQueryOnTable" of the TIBCO EBX® Insight Add-on - "matchAtOnce" of the TIBCO EBX® Match and Cleanse Add-on |
Max. duration in minutes | Theoretical maximum duration of the operation execution in minutes. This value can be changed by the operation when starting the communication protocol with the monitor |
Accept to be killed | This property is used to state if the operation is able to receive and manage a kill request from the monitor 'True': The operation can receive and manage a kill request from the monitor. 'False': The operation can not receive a kill request from the monitor. |
Configuration group
This group allows you to enable, disable and set configuration information for archiving and event tracking.
'Global' table
This table allows you to globally turn archiving and event tracking on/off, and specify the maximum number of records stored for each type of activity.
Property | Definition |
|---|---|
Enable archive | Turns automatic archiving on, or off. When the number of stopped operations exceeds the corresponding 'Max. number records' property value, the add-on begins the archiving process. The 'TIBCO EBX® Activity Monitoring Add-on - Archive' data space stores the archives. You can also configure automatic archiving based on the EBX® Scheduler. Refer to the 'Archive data space' section for more information. |
Max. number records | The number of stopped operations allowed before the add-on begins the archiving process. |
Enable event tracking | Turns event tracking on, or off globally. To enable types of events, such as session tracking, use the 'Event tracking' table. |
Max. number records | The number of records stored before the add-on begins deleting them—starting with the oldest. |
'Event tracking' table
This table allows you to enable/disable types of event tracking, such as session tracking. Currently, you can only use session tracking.
Property | Definition |
|---|---|
Code | The unique id for this type of event. |
Label | This event's name, such as 'Session tracking'. |
Description | The description for this type of event. |
Enable | Determines whether tracking for this type of event is enabled/disabled. |
Reference data
The following sections describe reference data.
State
Three states are used to manage the lifetime of an operation: Started, Stopped and Suspended.
Property | Definition |
|---|---|
Code | Any naming convention except the prefix '[ON]'. |
Label | The state label. |
Stop cause
Once the operation is stopped, it is possible to record a stop cause: Failure, Kill, Normal.
Property | Definition |
|---|---|
Code | Any naming convention except the prefix '[ON]'. |
Label | The stop cause label. |
Status
Status information highlights whether operations execute normally or in an atypical manner. Example status values include: 'Default' (normal execution), 'Exceed max. duration time', 'Not yet killed' and 'Stop exceeded max duration'.
Color coding for each status value provides a specific visual alert when querying the monitor. This can help you distinguish between an operation that stopped normally and one that stopped because it exceeded its maximum allowed duration time.
Property | Definition |
|---|---|
Code | Any naming convention except the prefix '[ON]'. |
Label | The stop cause label. |
Color | Color used to display the monitoring record when the status is raised. |
Priority level | More than one status can be raised for a same monitoring record. To decide which one is used for the color coding, the priority level is applied. A value of '1' is the highest level. |
Java class | Qualified name (package + class name) of the java class that is used to compute the status. |
'Event' table
This table stores values for predefined events and associates each one with a unique color.
Property | Definition |
|---|---|
Code | The predefined list of available events. |
Label | The event's label. Default values include the following events:
|
Color | The unique color assigned to each event. |