Cloud Software Group, Inc. EBX®
Data Model and Data Visualization Add-on Documentation > Developer Guide > Customizing graph nodes
Sample node template and configuration
Overview
Once you have implemented a node template, an administrator must include the template in a value and relationship graph configuration. The following section provides a node template code sample and instructions for adding it to an existing configuration.
Node template code sample
The following is a sample code for a node template:
public class nodeTemplateExample implements NodeTemplateFactory {

	private static final int DEFAULT_WIDTH = 275;

	public NodeTemplate build() {

		NodeTemplate template = new NodeTemplate();
		template.setShapeType(ShapeType.ROUNDED_RECTANGLE);

		NodePanel rootPanel = new NodePanel();
		rootPanel.setWidth(DEFAULT_WIDTH);

		NodePanel mainPanel = new NodePanel();
		mainPanel.setPanelLayout(PanelLayout.VERTICAL);
		mainPanel.setBackgroundColor("#0B2265");
		mainPanel.setMargin(MarginType.LEFT, 12);
		mainPanel.setMargin(MarginType.TOP, 12);
		mainPanel.setMargin(MarginType.BOTTOM, 12);
		{
			NodePanel imagePanel = new NodePanel();
			imagePanel.setAlignment(AlignmentType.MIDDLE_LEFT);
			{
				NodeImage image = new NodeImage();
				image.setBindingSource("/icons/w1.png");
				image.setHeight(50);
				image.setWidth(50);

				imagePanel.addElement(image);
			}

			NodePanel table = new NodePanel();
			{
				NodeDataTable dataTable = new NodeDataTable();
				dataTable.setAlignment(AlignmentType.CENTER);
				dataTable.setNumberOfColumns(2);
				dataTable.setColumnsWidth(new int[] { 100, 85 });
				dataTable.setRowSeparatorColor("#0B2265");
				dataTable.setBorderColor("#0B2265");
				dataTable.setBackgroundColor("#A5ACAF");
				dataTable.setTextColor("#A71930");
				dataTable.addRowData("Name:", "${/name}");
				dataTable.addRowData("Department:", "${/departmentID}");
				dataTable.addRowData("Managed By:", "${/supervisorID}");
				dataTable.setMargin(MarginType.BOTTOM, 10);
				dataTable.setMargin(MarginType.LEFT, 10);
				dataTable.setMargin(MarginType.RIGHT, 10);

				table.addElement(dataTable);
			}

			NodeExpanderButton expand = new NodeExpanderButton();
			expand.setTargetElement(table);
			expand.setAlignment(AlignmentType.MIDDLE_LEFT);
			expand.setMargin(MarginType.TOP, 5);
			expand.setMargin(MarginType.LEFT, 10);
			expand.setMargin(MarginType.BOTTOM, 5);
			expand.setBackgroundColor("#A71930");
			expand.setHeight(12);
			expand.setWidth(12);

			mainPanel.addElement(imagePanel);
			mainPanel.addElement(expand);
			mainPanel.addElement(table);

		}

		NodePanel indicatorPanel = new NodePanel();
		{
			NodeIndicator indicator = new NodeIndicator();
			indicator.setOpacity(1);
			indicator.setWidth(40);
			indicator.setHeight(40);
			indicator.setMargin(MarginType.LEFT, 10);
			indicator.setAlignment(AlignmentType.CENTER);
			indicatorPanel.addElement(indicator);
		}

		rootPanel.addElement(mainPanel);
		rootPanel.addElement(indicatorPanel);
		template.setPanel(rootPanel);

		return template;
	}

}
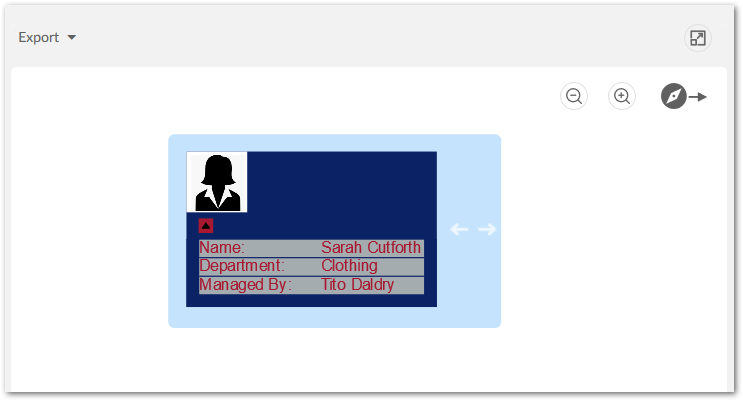
The following image shows the result of implementing the above node template:
Including a template in a graph configuration
To include a node template in a graph configuration:
Navigate to Administration > TIBCO EBX® Data Model and Data Visualization Add-on > Value and relationship graphs > Table configuration.
Open the desired table configuration and select the Node Style tab.
In the Node Template field, enter the fully qualified name for the class that implements the template.