Customizing styles
Overview
You can customize styles for data value graph nodes and relationships. Customization can be as basic as setting some default options, or as complex as basing style on the outcome of an evaluated XPath expression. You can also implement a Java class:
to define programmatic styles for links. A Java class allows you to define more complex logic, such as applying a style to only a specific foreign key path in the graph.
to create custom node templates. This gives you fine-grained control over the appearance of nodes. See Node templates for detailed instructions.
Note
Customization of link styles is only available for relationships set to display as lines and not containers.
Where and how to customize
Administrators can customize display in the following locations:
Administration > User interface > TIBCO EBX® Data Model and Data Visualization Add-on > Value and relationship graphs > Table configuration > Node Style:
Use the settings in the Default style group to determine how nodes display in normal conditions.
The Conditional styles group contains all of the same settings, but allows you to control the styles that display under specific conditions. Click the plus icon next to any style and fill in the required fields.
The Additional chart style group includes settings for using a Media-type field to display a digital asset on the node, adding display of additional fields to the node, and specifying a programmatically defined node template.
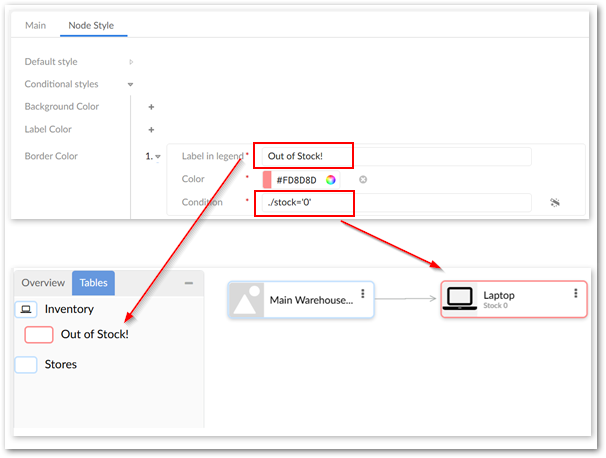
In the image below: the node border color changes for inventory items that are not in stock; the conditional label displays in the table legend to differentiate these nodes; the Inventory table node includes the additional Stock field.
Administration > User interface > TIBCO EBX® Data Model and Data Visualization Add-on > Value and relationship graphs > Link configuration > Link Style. Click the plus icon to edit link styles via the UI. Alternatively, use the Programmatic Style field to enter the fully qualified name to a Java class that defines link styles. The following image shows a customized link style: