Dashboards
Automated profiling dashboards
Dashboards generated when running the automated Launch data profiling service have an overview and a level you can drill down into and see more details on individual fields. The following image and table highlight the overview mode:
The following image and table highlight the options when viewing field details:
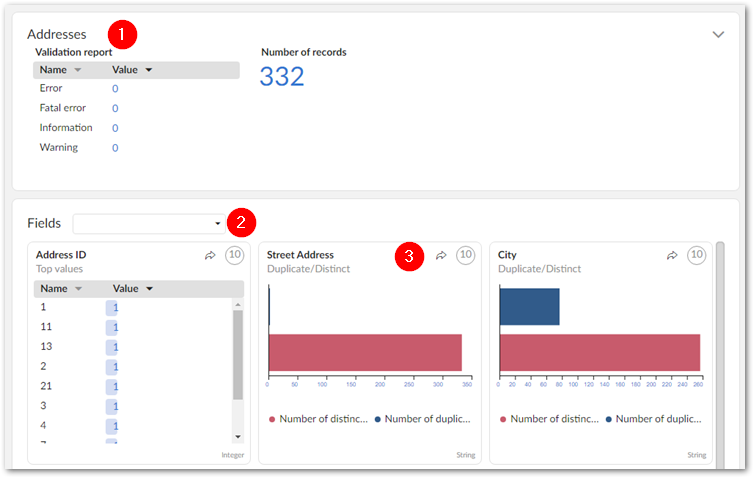
1) | Indicators that measure table data dimensions. |
2) | Indicators for each of the table's fields. The indicator and dimension used at the top level depend on the field's data type. Use the Fields drop down to locate a field. Note you can select a field by clicking to open the menu, or type a field's name to locate it. |
3) | View linked records by clicking the Click the numbered icon to drill down and view additional indicators applied to each field. |
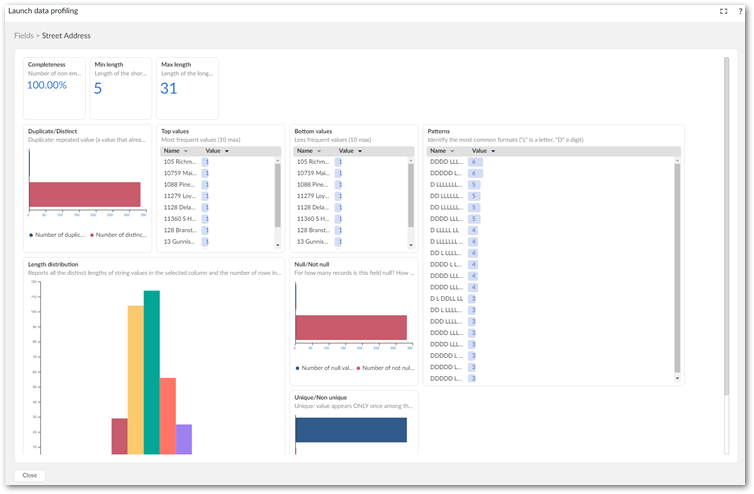
The following image shows an example dashboard after double-clicking to view additional field indicators:
Manually created profiling dashboards
Dashboards have the following two modes: view and edit.
The following image and table highlight options in the view mode:
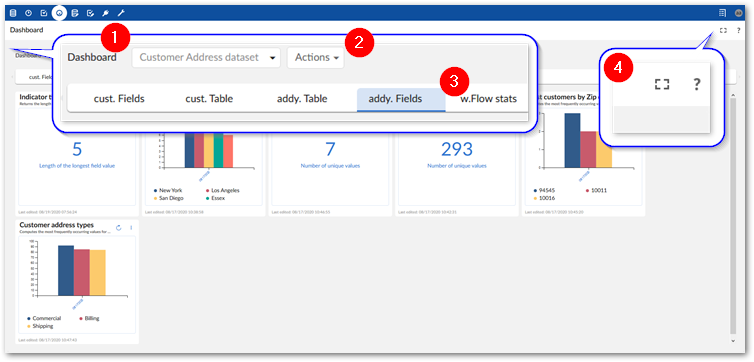
1) The Dashboard menu: | This menu:
|
2) The Actions menu: | This menu contains the following services and allows you to:
|
3) Section tabs: | Each tab displays the section name and highlights the currently viewed section. Drag and drop tabs to change the order of the sections. |
4) Fullscreen and help icons: | Opens the dashboard in fullscreen mode and accesses the online documentation, respectively. |
The following image and table highlight options available only in the edit mode:
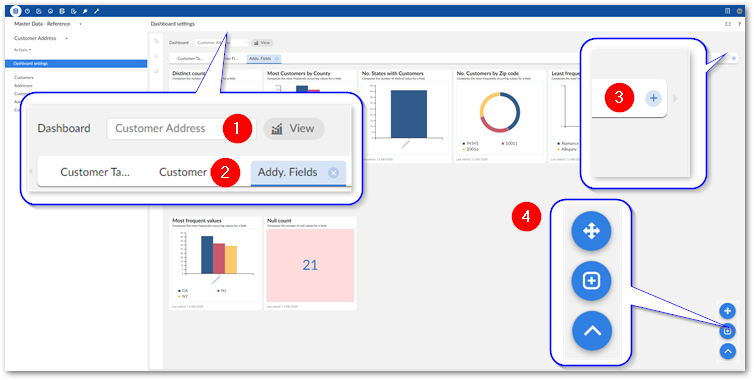
1) View icon: | Returns the dashboard to view mode. |
2) Section tab options: | Double-click to change the section name, or select the 'x' icon to delete it. |
3) Add section icon: | Creates a new section in this dashboard. |
4) Move, Add, Save (not shown) Collapse/Expand icons: | Move: Allows you to change the position of indicator tiles. Add: Creates a new indicator in this section. Save (not shown): Saves your changes after you rearrange indicator tiles. Collapse/Expand: Collapses or expands the above icons. |