Configuring indicators
Overview
When you first create an indicator, the add-on sets default options to expedite the creation process. You can adjust these settings at any time to meet specific business requirements. The following sections describes how to access these settings.
Configuring an indicator
To configure indicator settings:
Access configuration options when:
Creating an indicator by selecting the indicator's 'gear' icon.
Accessing a dashboard in the view mode by selecting an existing indicator's menu and choosing Edit indicator. Select the indicator's 'gear' icon to change settings.
Viewing a dashboard in edit mode, select the indicator you want to edit and then select the 'gear' icon.
Use the Indicator configuration window to update settings:
The following image and list of tab descriptions provides an overview of configuration options.
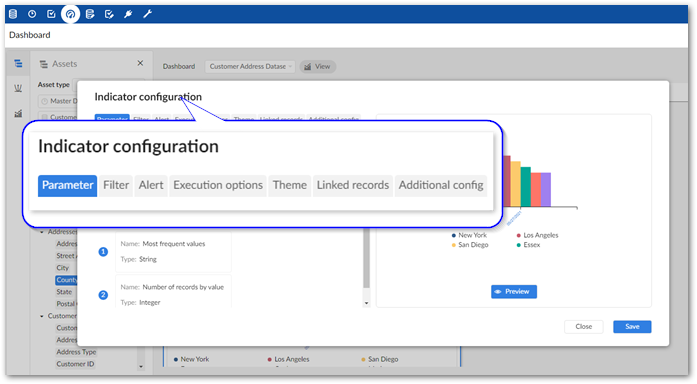
Parameter tab: Make any needed adjustments to the input parameters. Note that depending on the type of indicator, this tab might display non-editable information only. Among other things, input parameters can tell the add-on how to process a data asset and how to pass information presented visually. For example, setting the Most frequent values indicator to 3, displays the top three values returned by the indicator. The output parameter applies to the value returned by the indicator. Adjustments generally determine how data is formatted in the indicator display.
Filter tab: Create a filter to apply this indicator to a subset of table records. For example, you might want to filter an Employee table to only show employees hired after 01/05/2019. You would select the following options: Field: Hire date, Operator: is greater, Value: 01/05/2019. Note that the operators available to select and acceptable field values are based on the field's data type.
There is a limitation when filtering on a foreign key field where a label is specified in the data model. The following operators cannot be used in this case: starts with, ends with, contains, and is different.
Alert tab: Set alerts that change the indicator tile's background and optionally sends an email when triggered. For example, you might want to set an alert to send an email notification when the number of missing field values is equal or greater than 19. You would select the following options: Operator: >=, Value: 19. You can also change the background color that indicates an alert was raised and add email recipients who are notified when an alert is raised.
Note
The system automatically sets the sender of alert emails as the user that created the dashboard.
Note
To send email notifications, you must configure the SMTP server in your
ebx.propertiesfile. For instructions, see the TIBCO EBX® Administration Guide.Execution options tab: This tab allows you to specify how this indicator executes. On demand (default) or Schedule, or a combination of these options.
Chart theme tab: Select the theme that determines chart display options. From this tab you can also select Manage to create new themes and edit existing ones.
Grouping tab (not shown): Enable and specify options to group this indicator's results.
Linked records tab: Enable and specify options for linked records.
Note
Currently, linked record display is limited to 1000 records.
Additional config tab: allows you to:
Change indicator tile size. You can specify whether this indicator displays in a large or small size.
Set the computation periodicity for indicators. Currently, this is available for indicators that use the Number of operations and Number of users by operations functions.
Preview and save changes.