Execution, query and dynamic indicator report
- Integrated user interface
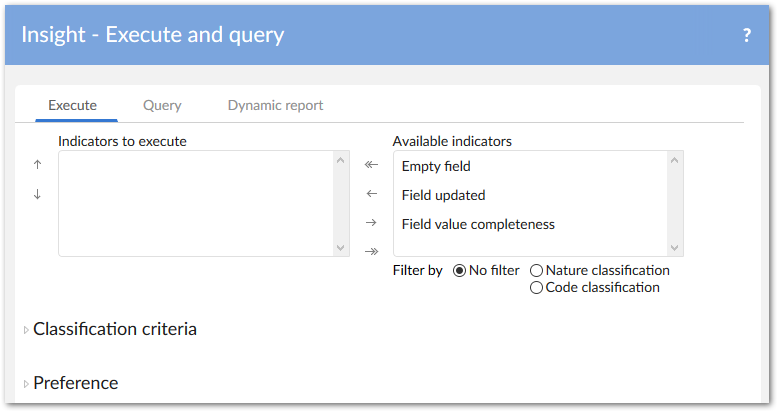
- Execution
- Query and data views
- Related records
- Filtering by dates
- Data analytics and chart types
- Dynamic report
- Indicator applied to a workflow
- Indicator applied to an operation
- Indicators preferences management
- Indicators classification management
- Viewing linked records
- Display rules
- Synthesis view
- Correlated watchdogs
Integrated user interface
A user interface allows executing, querying indicators and generating dynamic reports for an indicator either on a specific dataspace or a whole dataset or on a specific table.
Service location | |
|---|---|
| Access at the level of a dataspace |
| Access at the level of a dataset |
| Access at the level of a table |
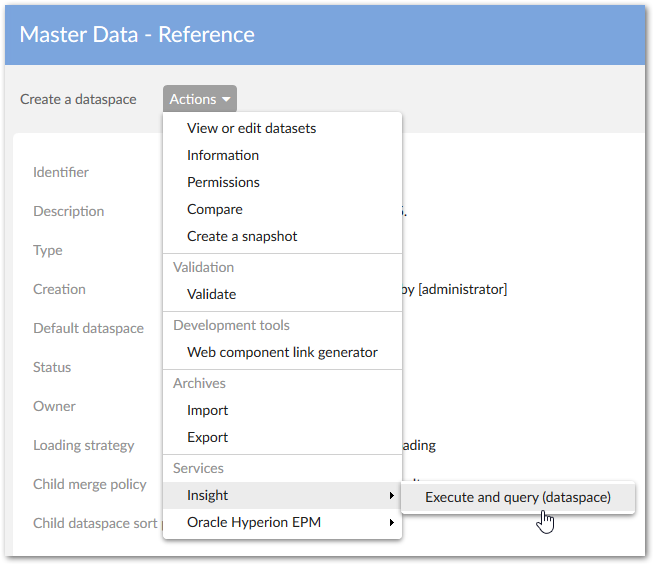
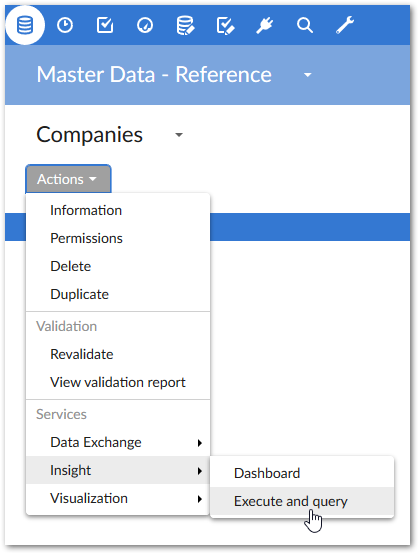
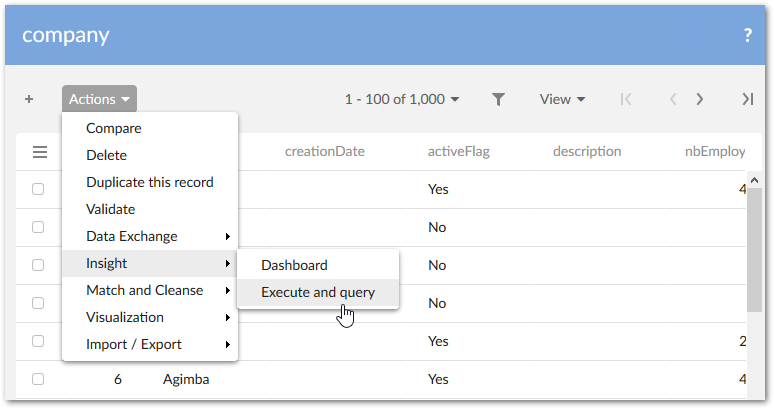
Table 2: Execute and query - Access levels
Execution
Two indicator execution modes are possible. They are found under Computation frequency in the configuration:
Real time: The indicator is executed in real-time when data changes. This indicator is associated with a probe, such as a trigger on a table or a listener.
On demand: The indicator is executed manually through the user interface in EBX®.
The following policy applies to indicator execution and includes permission rules (refer to the Permission section):
Only indicators with the Is active property set to
Yescan be selected.At the repository level, all indicators that are attached to workflows or Monitoring operations can be selected for execution.
At the dataspace level, all indicators that are attached to the current dataspace can be selected for execution.
At the dataset level, all indicators in on demand mode that are attached to a Data Element Concept in the current dataset can be selected for execution.
At the table level, all indicators in on demand mode that are attached to the current Data Element Concept can be selected for execution.
One or many datasets that share the same data model can be configured for an indicator to execute at the dataset level and the table level. Please refer to the Indicator on D.E.C. table for more information.
Special notation: | |
|---|---|
| An API is available to execute indicators from an external scheduler. |
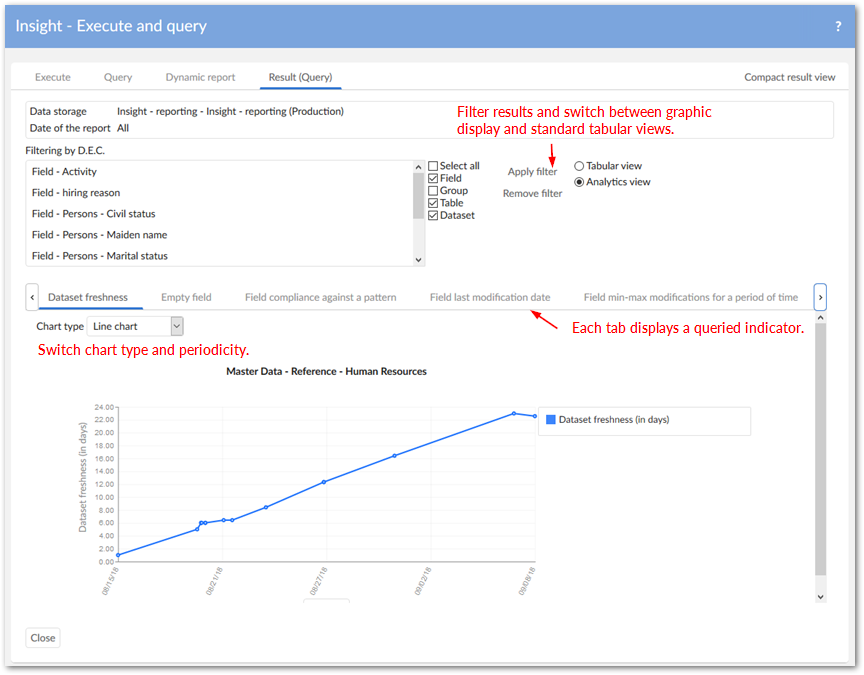
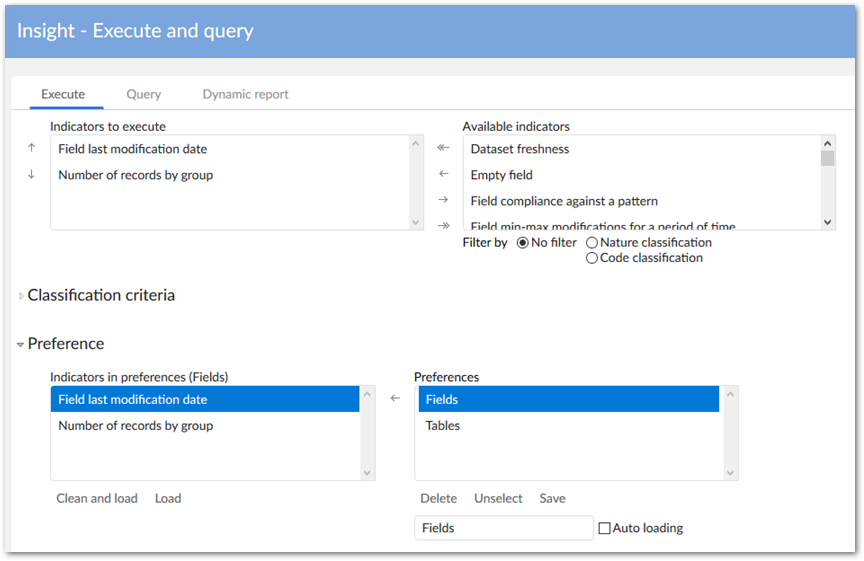
Query and data views
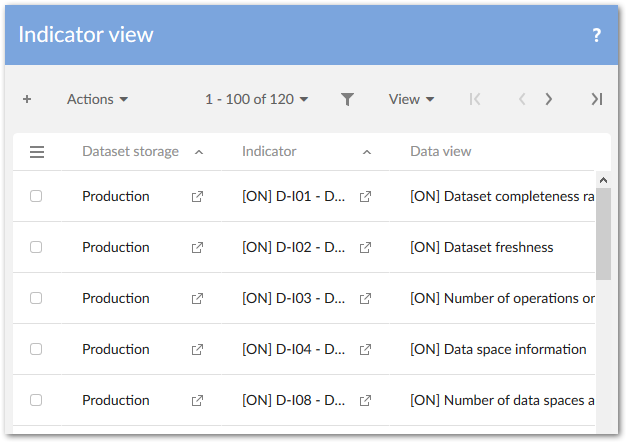
The integrated query in EBX® allows you to obtain a data view, for the indicator results, based on the Big data report table. You can execute the query at the repository, dataspace, dataset or table level.
The following rules are applied and enriched with the permission rules (refer to the section Permission):
All indicators can be selected, regardless of their computation frequency and their activation status.
The list of indicators available to query is made up of all indicators attached to the D.E.C.s of the current access level.
Users must select a date filter and the targeted data storage to query. Only the data storage used in the associations between the Data Element Concepts (D.E.C.) and the indicators display (Indicator on D.E.C. table in the add-on configuration area).
At the dataspace level, the results are filtered by the current dataspace.
At the dataset level, the results are filtered by the current dataset.
At the table level, the results are filtered by the current dataset and the current table.
The add-on provides one prebuilt data view by indicator. These data views can be listed in the administration part of EBX® Views configuration dataset (they are also documented in the Indicators portfolio guide).
The data view displayed by the indicator can be changed. This means that an organization can change the default data views provided by the add-on. The attachment of a view to an indicator is done by dataset storage where the flat reporting table (either the Flat result table or the Big data report table) is located (refer to next section about the configuration of the add-on):
Special notation: | |
|---|---|
| The data views provided by the add-on must not be modified directly because they are set up during the upgrade process. To customize them, you need to copy the views and then apply the modification on these copies. |
| The data view must filter the results of the big data reports by the indicator code on which it is applied. This means that the correct code indicator must be used to filter the data view depending on this indicator. When you create a new Indicator definition, you must configure the data view by using a filter applying the code of this Indicator definition. The default data views provided by the add-on apply this filtering by using the indicator code |
Related records
Some indicators support storage of related, or linked records for each execution. For example, the Number of missing values for a field indicator saves a list of records that have an empty value in the specified field. As shown below, you can access these related records in the indicator's result view:
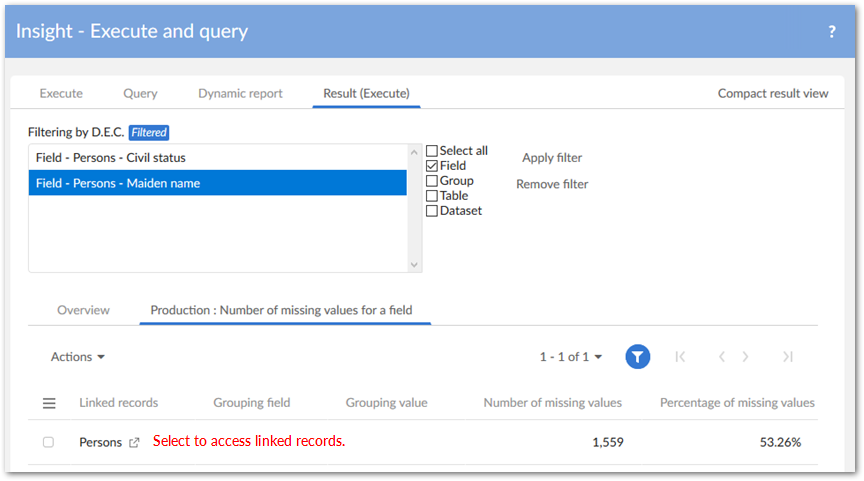
If the indicator supports multiple related records, you can filter these records using the options in the Select a linked record option list.
Related records for indicators are not activated by default. Refer to the Indicator definition section for configuration information.
Special notation: | |
|---|---|
| Related records may also be referred as linked records in some screens and documents. |
Filtering by dates
The Date of the report filtering allows you to select a date based on these options:
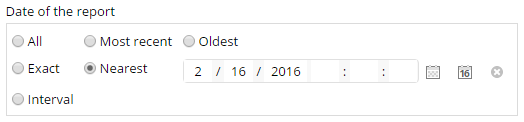
Depending on the selection, the results are filtered as follows:
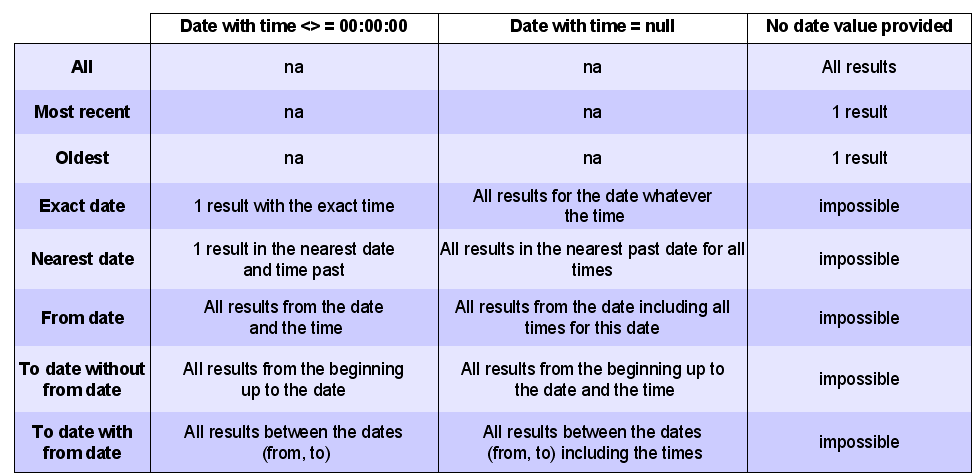
Those indicators that supports periodicity control also apply special rule to filter result by date except for the All and Exact filters. Period start date, end date and execution date are used to perform comparison logic.
Most recent filter: using period end date and execution date for comparison.
Oldest: using period start date and execution date for comparison.
Nearest: using period end date and execution date for comparison.
Interval: using execution date for comparison. Therefore indicators result can be retrieved if and only if specified interval covers the period in which indicators are executed. For example, suppose an indicator I1 with monthly period executed in July 2017. If users select interval from [05/07/2017 to 04/08/2017] then no result obtained because indicator's period is [01/07/2017 - 31/07/2017] which is not fully covered by selected interval. However when they change interval's from date to 01/07/2017 or any day before that they can get correct result.
The Exact filter applied on indicators with periodicity still uses execution date for comparison.
Special notation: | |
|---|---|
| The Exact filter for indicators with periodicity may no longer use execution date to perform comparison in the future. |
Data analytics and chart types
An indicator can be associated to graphical views and, after running a query, you can display the graphs using the Analytics view radio button. The image below highlights some additional options, and the following sections highlight available chart types:
Special notation: | |
|---|---|
| To get complete graphs, it is recommended to set the Save only last value properties to |
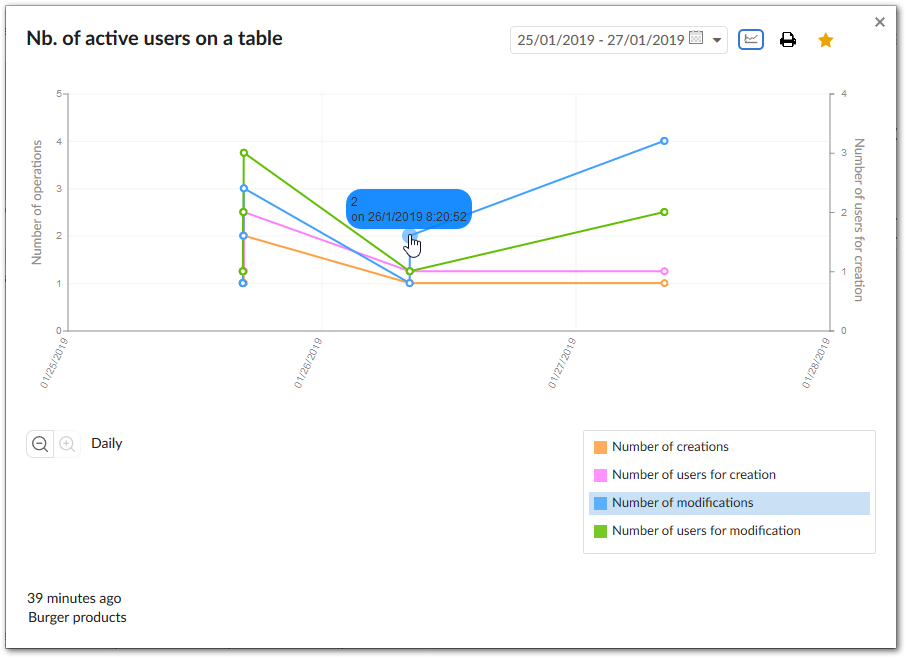
Line charts
Line charts work well to display results from monitoring data, or activity over a period of time. The image below highlights some of the line chart features:
Pie charts
You can view this chart type when an indicator has more than one output parameters. This means, for example, that an indicator providing just one measure that is an integer cannot benefit from a pie chart representation. When a bespoke indicator is implemented, the API provided by the add-on allows you to configure how the output parameters must be used to create suitable axis on the charts (refer to Java doc).
The standard chart gives the trend of the indicator over time whereas the pie chart provides a consolidated view of the results.
You can choose to display pie charts from either the latest results (Only last measure) or accumulative results over time (Addition or Average - Boolean outputs don't support the Average mode). The default pie chart mode is configurable for each indicator (refer to the Indicator definition table section).
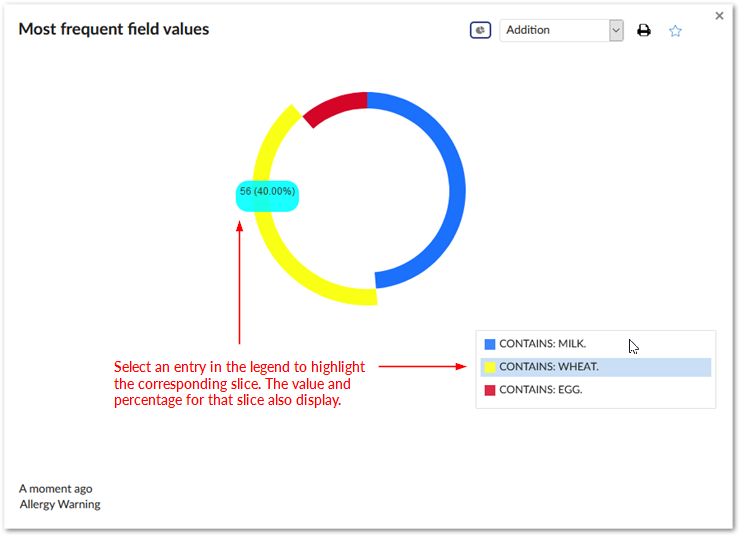
Note
An indicator may have more than one pie chart displayed at the same time depending on its output parameters. To ensure best visual experience, the maximum number of displayable categories is 10. If there are more than 10 groups, the 10th would be constituted by the remaining groups.
Bar charts
This chart type is available when an indicator has at least one numeric output parameter. A time slice option must be selected to display the averages of indicator results periodically, such as days in week, months in year, etc. The default periodicity is configurable for each indicator (Refer to the Indicator definition table).
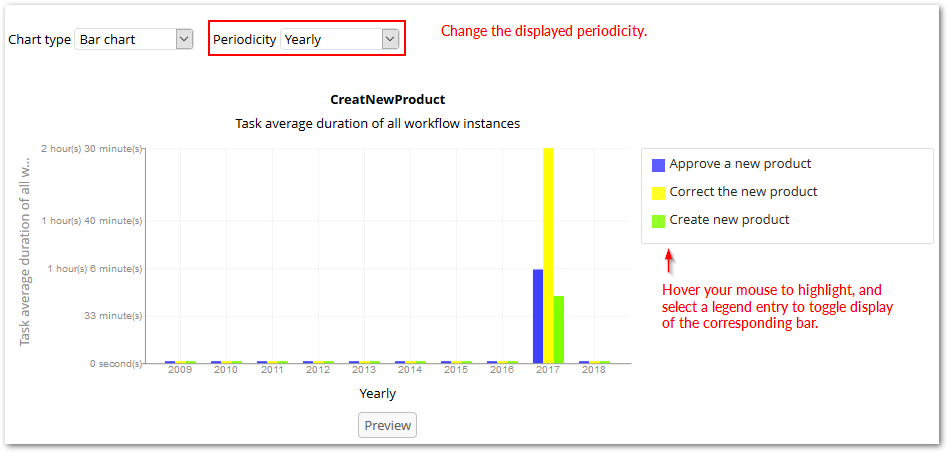
It depends on the indicator that all the numeric output parameters are included in a single bar chart or divided into separate bar charts.
Bar chart display reference
The following matrix shows how bar charts display results depending on the periodicity and selected chart mode display type:
Chart display mode | Display based on periodicity of control | |||||
|---|---|---|---|---|---|---|
Daily | Weekly | Monthly | Quarterly | Semester | Yearly | |
Daily | The last execution from the day. This is also the displayed value when no periodicity of control is available for an indicator, or it is set to Any. | |||||
Weekly | The sum of the last execution of each day during the week. | The last execution of the week. This is also the displayed value when no periodicity of control is available for an indicator, or it is set to Any. | ||||
Monthly | The sum of the last execution of each day during the month. | The sum of the last execution of each week during the month. | The last result from the month. This is also the displayed value when no periodicity of control is available for an indicator, or it is set to Any. | |||
Quarterly | The sum of the last execution of each day during the quarter. | The sum of the last execution of each week during the quarter. | The sum of the last execution of each month during the quarter. | The last quarterly execution result. This is also the displayed value when no periodicity of control is available for an indicator, or it is set to Any. | ||
Semester | The sum of the last execution of each day during the semester. | The sum of the last execution of each week during the semester. | The sum of the last execution of each month during the semester. | The sum of the last execution of each quarter during the semester. | The semester's last execution result. This is also the displayed value when no periodicity of control is available for an indicator, or it is set to Any. | |
Yearly | The sum of the last execution of each day during the year. | The sum of the last execution of each week during the year. | The sum of the last execution of each month during the year. | The sum of the last execution of each quarter during the year. | The sum of last execution of each semester during the year. | The year's last execution result. This is also the displayed value when no periodicity of control is available for an indicator, or it is set to Any. |
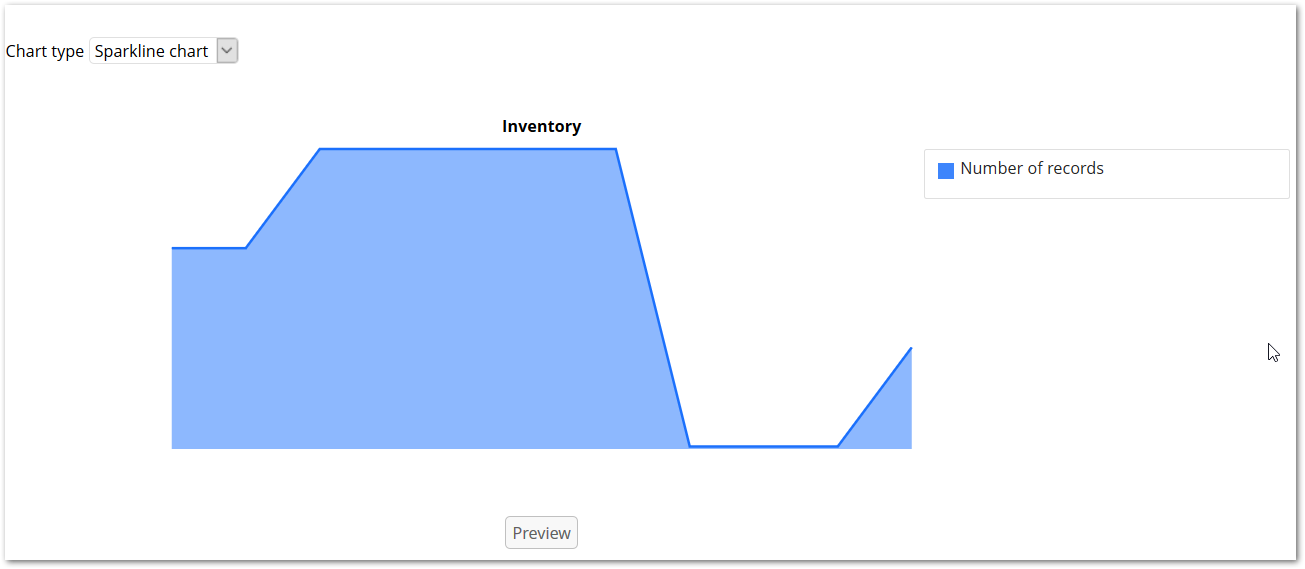
Sparkline charts
Sparkline charts are available for indicators with numeric outputs. The image below shows an example:
Dynamic report
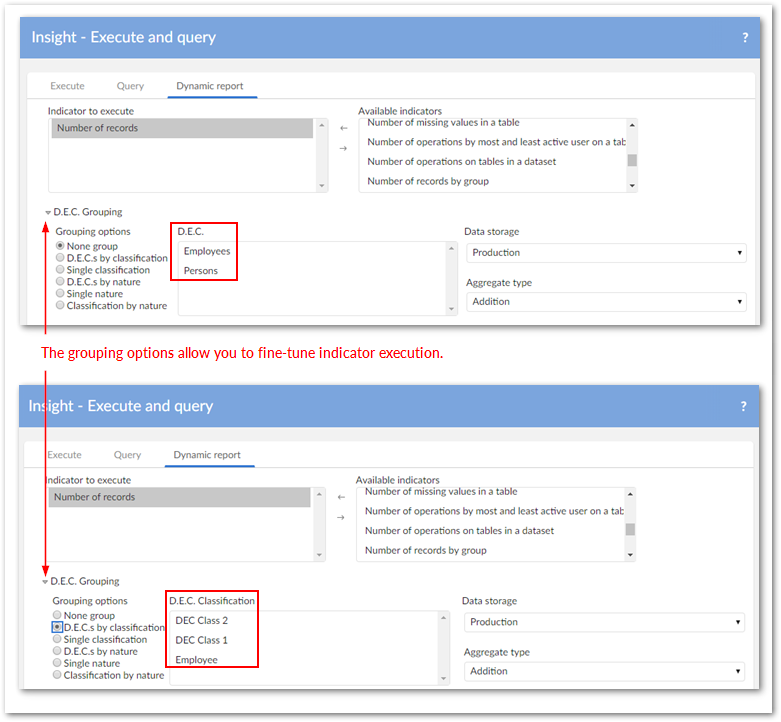
Dynamic report service permits to calculate and merge indicator result for several D.E.C.s and retrieve result in the past for indicators supporting periodicity. After clicking on the Execute and Query item you will see new tab labeled Dynamic report.
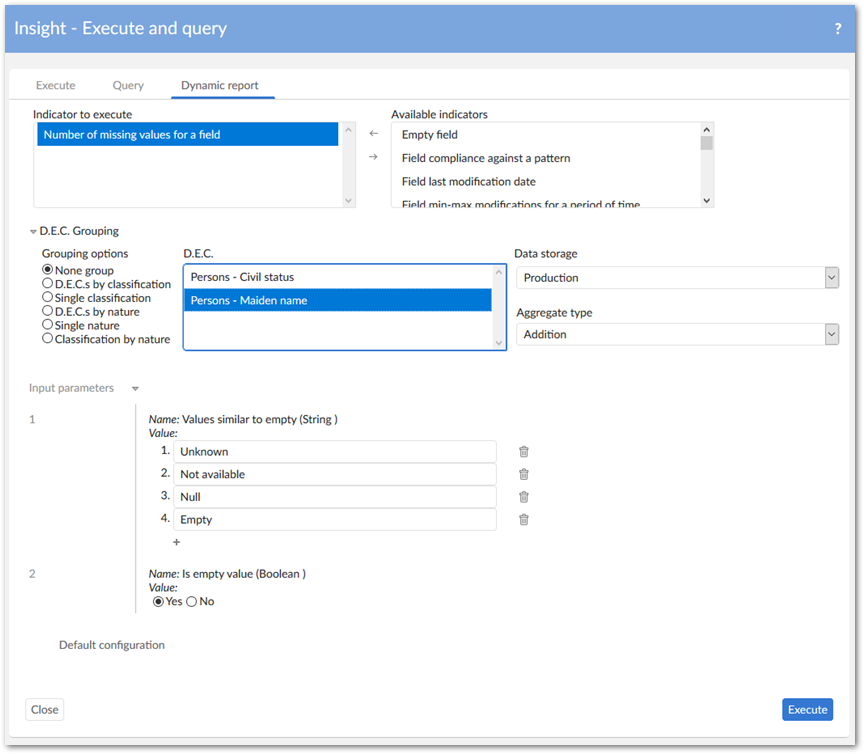
While the Execution and Query services can process several indicators at a time, the Dynamic report service can only execute one on one but it offers much of flexibility:
The ability to obtain result for multiple D.E.C.s to which the indicator is attached. Result for several D.E.C.s can be additive or average - this is called aggregated result.
All D.E.C.s are loaded by default but can be filtered using several options. After D.E.C.s are loaded, you can also limit the result by highlighting the desired D.E.C.s. For example, in the picture above even when there are two D.E.C.s for the Number of missing values for a field indicator, only the result of the Description field on the Business table (highlighted D.E.C.) is shown upon clicking on the Execute button.
Options for filtering D.E.C. are described below:
None group: all D.E.C. are loaded.
D.E.C.s by classification: D.E.C. classifications that D.E.C.s belong to will be loaded. Result for D.E.C.s and classification is shown.
Single classification: Same as above but D.E.C.s result is grouped by classification.
D.E.C.s by nature: D.E.C. nature will be loaded to the box. Result for D.E.C.s and classification nature is shown.
Single nature: Same as above but result is grouped by D.E.C. nature.
Classification by nature: two boxes are shown; you have to choose exactly one D.E.C. nature first then all classifications belonging to this selected nature will be loaded. Result for the selected nature will be merged by its selected classifications.
The ability to alter input parameters: if the selected indicators have input parameters, then they can be modified in the context of the Dynamic report service. This feature allows you to adjust input parameters based on their business logic assessment. At any time you can restore the default value for these parameters by clicking on the Default configuration button. These custom settings are only applied within a dynamic report execution context and will not affect the default configuration of the indicator.
The ability to obtain result in the past for indicators supporting period parameters. As usual while executing these indicators (Execution service), the result will be computed based on the execution date. This service is more flexible, because it allows you to select any point of time.
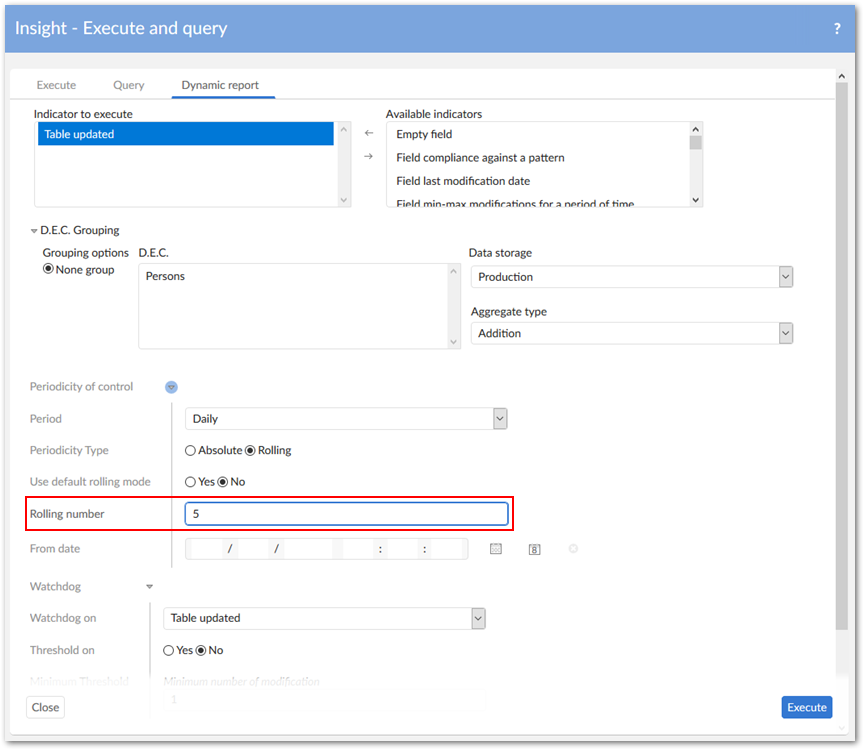
As shown in the figure, you can choose the date from which result will be computed and the unit of time that result will be based on. In addition, you can always select previous mode by setting Periodicity of control to Absolute. The rolling number is an additional validation that controls the value of this attribute to avoid an excessive number and a drop in performance. Currently, the maximum value allowed is 30 if you enter any value greater than 30, an error message will display asking you to correct this value before launching the service.
The elements in D.E.C. Grouping section are handled in the administration area of the EBX Insight Add-on located under the D.E.C. definition section. The figure below shows the relationship between them.
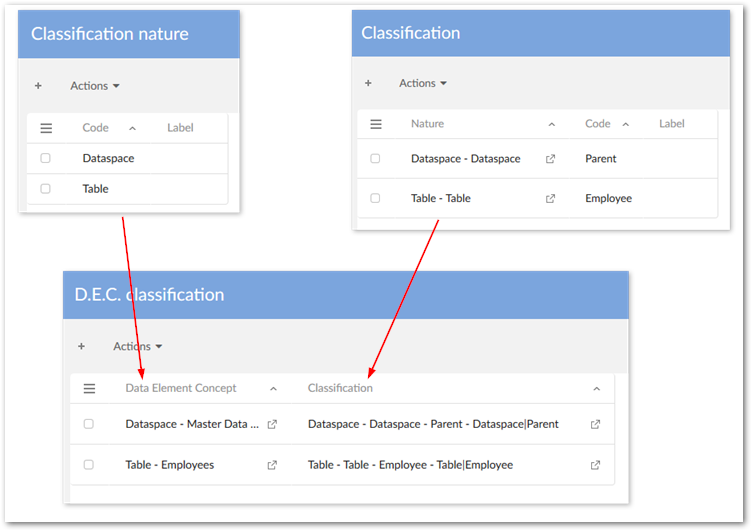
This configuration conveys following information:
There are two entries in classification nature: DEC Nature 1 & DEC Nature2.
There are two entries classification: DEC_Class1 and DEC_Class2. DEC_Class1 belongs to DEC Nature 1 and DEC_Class2 belongs to DEC Nature 2.
The Articles table belongs to DEC Nature 1.
The Businesses table belongs to both DEC Nature 1 and DEC Nature 2.
Therefore, different D.E.C. grouping options show different initialization parameters as illustrated below:
Because the Number of records indicator is defined for both D.E.C.s Table - Articles and Table - Businesses, so when Grouping option is none, these D.E.C.s will be loaded into the filter box on the right of the Grouping options window. However, when the Grouping option D.E.C.s by classification is selected, this filter box is filled with classification entries that D.E.C.s belong to - in this example DEC_Class1 and DEC_Class2. Execution result will be displayed based on D.E.C.s and classifications.
Indicator result has two main parts: one is aggregated result in tabular form and the other is graphical representation. You can view separate result by checking the Display table of separated results option. Too many graphical figures in the result may cause visibility issue, you can click on the Preview button to open them in a new pop-up window. The result of the Dynamic report service is initially stored in memory rather than in the configured storage location. To save it in physical storage - simply click on the Save button.
Indicator applied to a workflow
The indicators that are related to a workflow are available at the Reference dataspace level. They are not available at the dataset level and the table level.
Indicator applied to an operation
The indicators that are related to an operation are available at the Reference dataspace level only. They are not available in other dataspaces or at the dataset level and the table level.
Indicators preferences management
A preference is used to group one to many indicators that are ready-to-use for the query and the execution. The snapshot below illustrates three preferences that group indicators on different topics. For instance, the preference Indicators on boolean field contains these indicators:
A preference is owned by the user-profile who created it. It is not applied to a role. A user-profile can configure as many preferences as needed. Included in these preferences, is the Auto-loading preference. Auto-loading enables the automatic load of indicators upon the display of the execute and query UI (respectively the list Indicator to execute and Indicator to query).
Indicators classification management
It is possible to filter the list of indicators (execute and query) by nature of classification or code of classification. It allows you to easily obtain a subset of indicators for a certain classification (refer to the add-on configuration for the classification scheme).
Viewing linked records
Users can be allowed to view records linked to chart values. Depending on the chart type, they can access this service when:
Pie charts: selecting a section to highlight it. Then, right-click the section and select the service.
Bar charts: right-clicking on a bar and selecting the service.
Line charts: right-clicking a value point and selecting the service.
Sparkline charts: hovering your cursor on the chart until the value displays. Then, right-click and select the service.
To enable this feature if you are an administrator:
In the configuration area, open the Indicator on D.E.C. table and select the indicator on which you want enable linked record viewing.
Set the Linked record field to Yes.
Save and close.
Display rules
The table below gives the display rules applied to make available the indicators in the Execute and query service depending on the user context.
User context | Display rules | |||||||
|---|---|---|---|---|---|---|---|---|
Dataspace reference | Dataspace | Dataset | Table | Dataspace indicator | Dataset indicator | Table indicator | Field indicator | Workflow indicator |
X | Of the selected dataspace | No | No | No | No | |||
X | No | Of the selected dataset and all that are based on the same data model | Yes on all tables of the dataset | Yes on all fields of the tables | No | |||
X | No | No | Yes on the table | Yes on the fields of the table | No | |||
X | Of the repository level | No | No | No | Yes all workflow | |||
Table 4: Synthesis of the display rules for the execution and query depending on the user context
Synthesis view
The Synthesis view UI allows you to display indicator results as a condensed computation. For instance, if the Number of records indicator is queried on three tables, the synthesis view displays the average of the three results. The synthesis displays in a condensed view the digital results (number) the boolean, the percentage (graphical bars) and the dates.
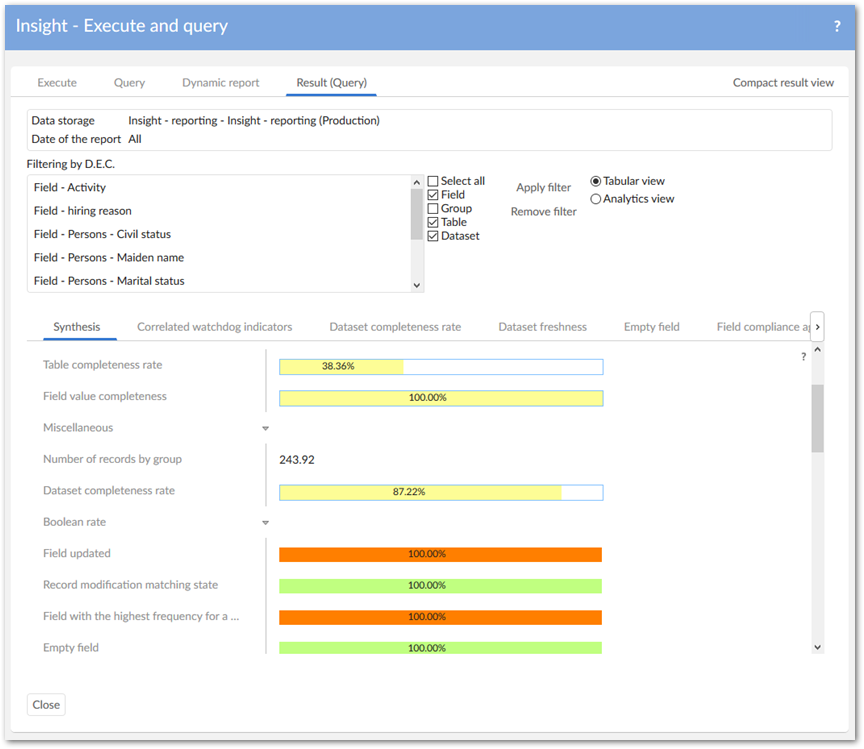
You must configure this view before using it. Please refer to the Synthesis configuration section.
Correlated watchdogs
Apart from using the default watchdogs of indicators, which are only available for boolean outputs, it is possible to define watchdog indicators via expressions on all types of outputs and combine two or more watchdog indicators into a correlation.
For instance, you can define a watchdog to inform you when the Number of records is greater than a certain threshold, then define another watchdog to be raised when the Most frequent value contains John Smith, and combine those conditions to alert you when both of them are true.
The watchdog indicators and correlated watchdog indicators are executed right after the indicator execution and displayed in the respective tabs as illustrated below.
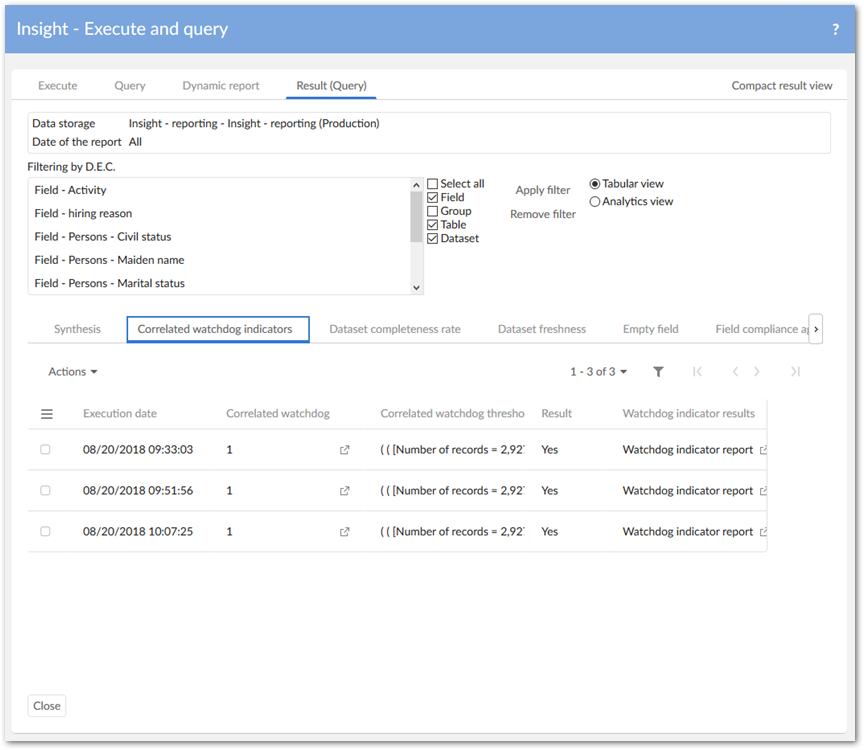
You must configure watchdog indicators and correlated watchdog indicators before using them. Please refer to the section Configuration of the Correlated watchdog configuration.