Grouping indicator results
Overview of grouping values
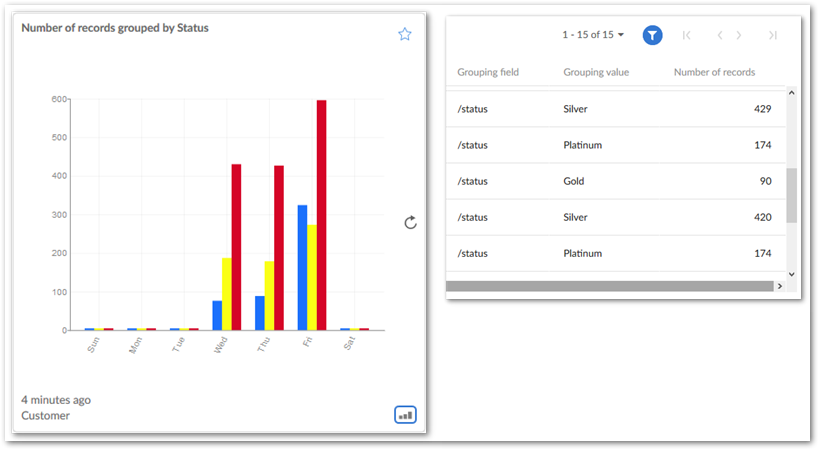
The EBX Insight Add-on permits grouping of indicator results based on field values. Grouping can shed additional light on data displayed in indicators. For example, instead of just showing how many records a table contains, grouped results can show how many records contain particular values. The image below demonstrates this by displaying how many members hold a particular status. The image highlights: a dashboard tile (left); query results over time (right):
Administrators configure grouping options on individual indicators. When enabling grouping from the Indicator definition table, grouping is active each time the indicator is associated with a D.E.C. You can adjust all configuration options from the Indicator on D.E.C. table when associating indicators with D.E.C.s. Note that grouping is only available for select indicators. See Grouping availability for a list of available indicators.
When enabling the grouping feature, you can also:
Determine how groups display in charts: stacked or separated.
Set a limit on the number of groups that display. Any group(s) that do not display individually get included in an "Other" bar/line. When limiting groups, you can specify the order in which groups display.
Apply an Order by value to sort grouped records by a field value.
Configuring group display
The following instructions assume that a D.E.C exists, or that you have existing indicators attached to D.E.C.s. To configure group display of indicator values:
Navigate to Administration > Data quality and analytics > TIBCO EBX® Insight Add-on > Indicators.
From the Indicator on D.E.C. table open an existing record, or create a new record to add an indicator to a D.E.C.
Activate the Enable grouping option and save, but do not close the record.
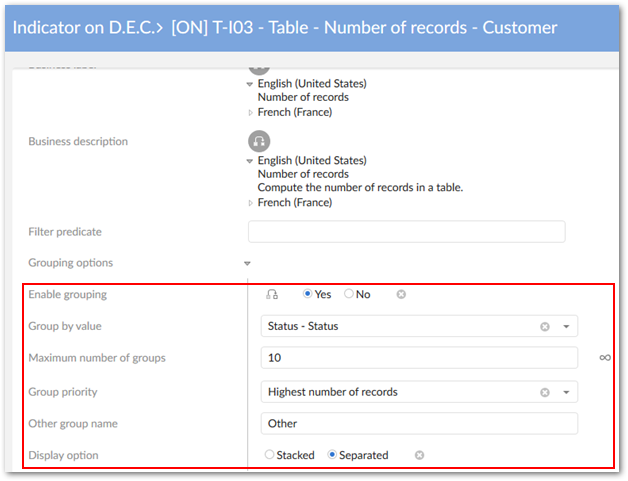
Set the following properties as required (not all options may display, depending on the indicator):
Group by value: Set which field contains the values you want to group. Groups of values display as lines/bars in charts.
Order by: Optionally, indicate which field is used to sort the groups. When viewing a tabular view of linked records, they will be sorted according to this value.
Maximum number of groups: Optionally, specify how many groups display in the chart. All remaining groups are combined.
Group priority: Determine the order in which groups display. You can choose whether the order begins with groups containing the highest, or lowest number of records.
Other group name: Optionally, specify the name for the combined groups.
Display option: Specify how charts display the groups.
Save and close. The results will be available to users who can query, execute, and view this indicator.
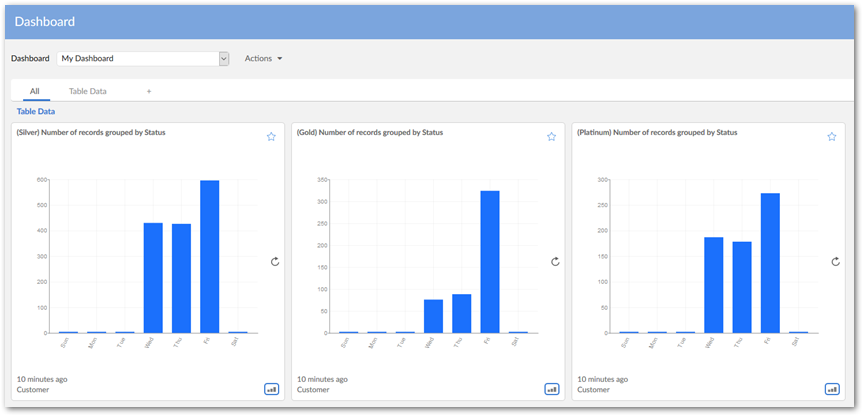
Separating groups into individual dashboard tiles
Groups can be separated so that they each display in a different tile. This can be useful to see the development of a single value over time. For example, how the number of Gold level subscribers fluctuates quarterly. If you have administrative access, you can activate this functionality in the Indicator in section table by enabling the Separate tiles by group option.
Grouping availability
The following table lists the indicators where grouping functionality is available:
Indicator application | Grouping availability |
|---|---|
Tables |
|
Fields |
|
Groups |
|