Result storage
Data structure for saving indicators results
Every indicator saves its results in two different data structures that are compliant with the relational persistence mode of EBX®. This means that these tables can be accessed directly through SQL by third party tools, bypassing access to the semantic datasets.
The first data structure, named Flat data report (which has replaced Big data report since v2.0.0), is fully de-normalized. This is a 'flat' data model that allows you to easily query the data without enforcing join table statements. The Flat data report table is used by EBX® to provide ready-to-use integrated reports by defining data views that are applied on the indicators. These data views can be modified through a simple configuration in EBX®. Because dynamic field labels and descriptions have been added, there is no need to extend the Flat data report table each time you create a new indicator. This table also permits business operations, such as sending an email at the record level.
The second data structure is less de-normalized than the Flat data report . It relies on the Indicator report and Indicator value tables. To query these tables, a join statement is required, in a process that is more complicated than the Flat data report table. However, this data structure still remains stable when a new indicator is created, as it is more generic than the Flat data report structure. EBX® does not provide any ready-to-use reports on these tables. An organization must use its own reporting tools to query the data.
The add-on systematically saves the results of the indicator execution into both data structures (see also appendix Report data structures).

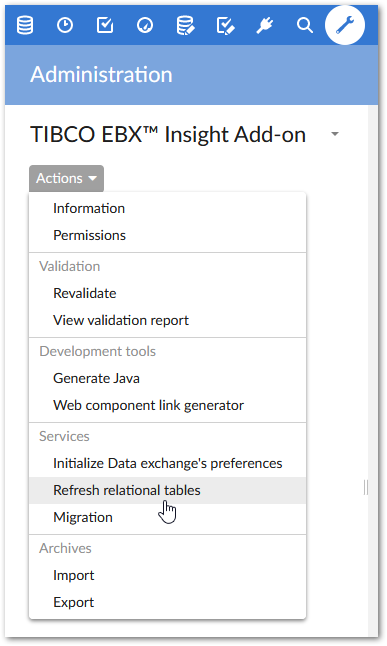
To ensure that access to only these two data structures is sufficient for building any report, some data values must be replicated from the semantic configuration (such as periodicity of control, computation frequency, part of D.E.C. and indicator data). This replication is performed automatically whenever a modification is applied to the configuration. However, in case of archive imports directly into the configuration, it is necessary to force a refresh of the replicated data. To do so, the Refresh relational tables service, is available at the level of the configuration of the add-on (see figure).
The Removed boolean value allows you to state that a D.E.C. or and an indicator has been removed from the configuration. This deleted asset remains in the reporting data model until it is manually deleted or cleaned up through a purge.
Special notation: | |
|---|---|
| The Big data report table will not be available if you start directly with v2.0.0 or a higher version of the EBX Insight Add-on. This table will no longer be supported in the future. It is recommended to adapt your custom indicator implementations and run the Migrate to the "Flat data report" table service after upgrading from a version older than v2.0.0. |
Storage with history
You can specify whether or not to store result history for each data structure and indicator. See the Save only last value in indicator report table and Save only last value in flat reporting table properties applied on the indicator definition.
Special notation: | |
|---|---|
| The option of saving a new measure every time an indicator is executed allows you to collect row information for data analytics operations. |
Data storage localization
The results storage (data schema) location is configured when defining an indicator with a dataspace and dataset selection. When an indicator is attached to a Data Element Concept, it is possible to override this information if necessary by selecting another dataspace and dataset.
Special notation: | |
|---|---|
| Two ready-to-use data storages are provided. Their dataspaces and datasets are named by the add-on and they can not be changed. A business label is available to provide a custom business name:
|