Add-on configuration
Configuration overview
Add-on configuration takes place in the Administration area of TIBCO EBX®. Once configuration is complete, user profiles granted sufficient permission can view and execute indicators. See the Example configuration section below for steps that describe the configuration process in detail. The following list and accompanying image outline the configuration process:
Location | Configuration step |
|---|---|
|
|
Example configuration
The following steps outline how to configure the EBX Insight Add-on. The example presents a basic use case and uses indicators included with the add-on's portfolio of indicators. If you have questions about a particular property while configuring, you can open the item's tooltip for more information.
To configure the add-on:
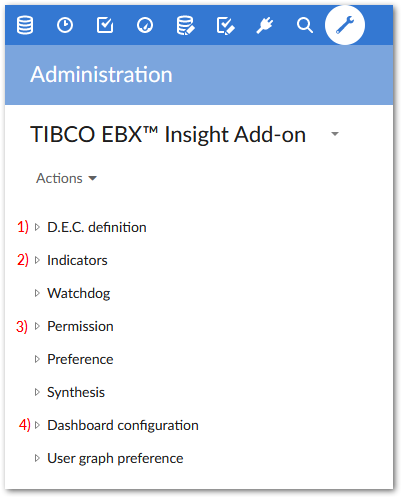
Navigate to Administration > Data quality & analytics > TIBCO EBX® Insight Add-on > D.E.C. definition > D.E.C. (Data Element Concept). This table contains all D.E.C.s registered with the add-on. The table defaults to displaying a hierarchical view of any registered assets and their related D.E.C. types. In this example we'll create new table and field D.E.C.s.
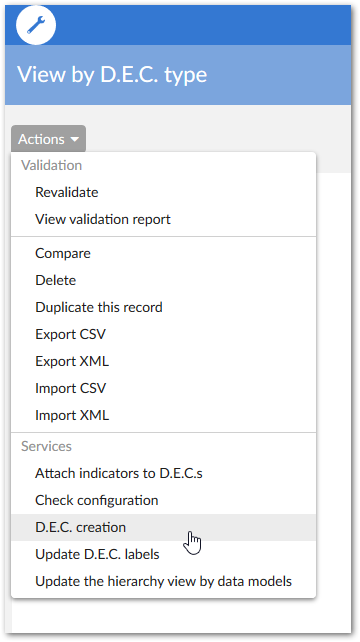
From the table's Actions menu, select D.E.C. creation.
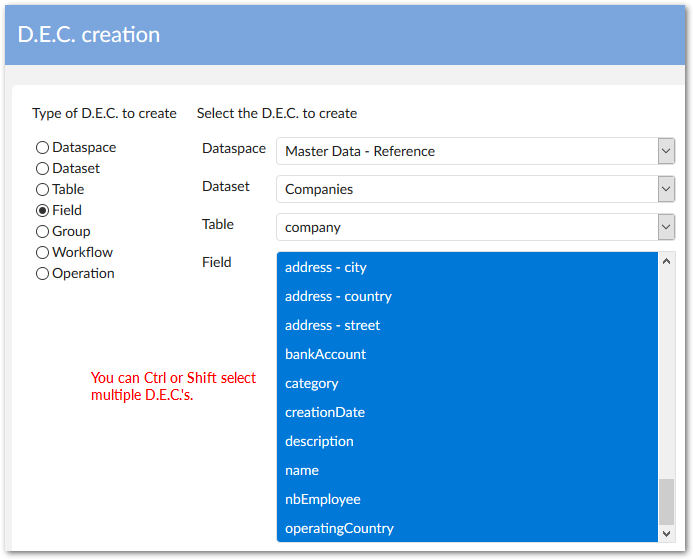
On the D.E.C. creation page, use the radio buttons on the left to select the D.E.C.'s type and the dropdown lists on the right to point to the asset location. After clicking Execute, the add-on registers the D.E.C. and returns you to the creation screen where you can continue to register D.E.C.s.
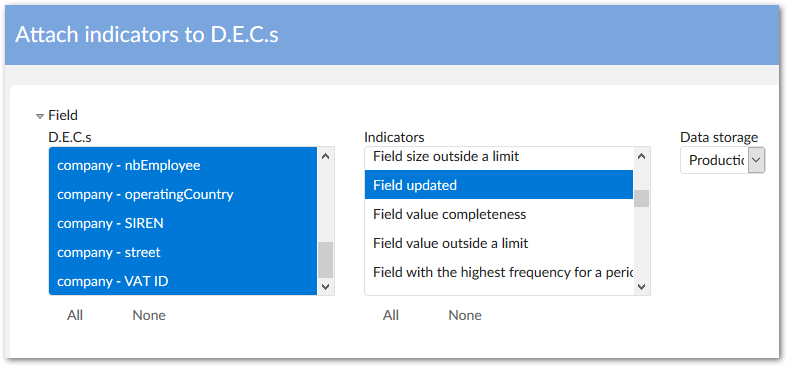
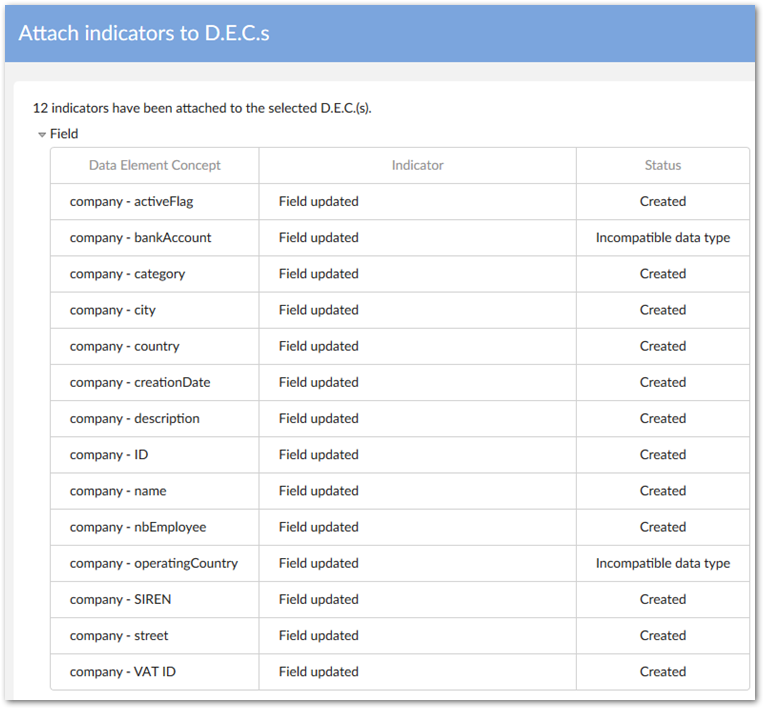
After creating and registering them, you can attach indicators to D.E.C.s. From the D.E.C. (Data Element Concept) table's Actions menu, select Attach indicators to D.E.C.s. In the page that displays you can select which indicators you want to attach to which D.E.C. As shown in the image below, the D.E.C.s are grouped according to type on the left of the page and the indicators available to attach to each type are located on the right. Note that you can Ctrl, or Shift + Click to select multiple indicators.
After clicking Execute, a results page displays. At this point you can go back and continue attaching indicators, or exit out.
Note
In the next couple of steps, we demonstrate creating a dashboard. However, a dashboard isn't required for users to run the Execute and query service. If you've already attached indicators to D.E.C.s, and you don't want to create a dashboard, you can skip to the step below that describes enabling access via permissions.
To create a dashboard, open the Dashboard configuration group, select the Dashboard table and create a new record. You'll need to supply a name and can optionally apply a custom template and change indicator output colors.
Indicators are grouped in sections in dashboards. So you can use the following to:
Section table — Create sections to add to dashboards.
Indicators in section table — Add indicators to the sections. In this table, take note of the Available display modes property. This property determines which display modes users can access when viewing the indicator. You can also specify the default display mode using the so named property.
Sections in dashboard table — Add sections to your dashboard(s).
To provide users access to add-on functionality, you can specify the appropriate permissions in the Permission group's Default permission table. Note that permissions here only enable users to access the Execute and query service. To enable users to access the dashboard, you'll also need to update the Dashboard configuration group's Permission table. You have fine-grained control over permission levels. For example, you can specify that users who don't have access to the data measured by the indicator can still execute the indicator and view any feedback. The User Guide contains detailed information on setting permissions.