where <IP address> is the address of the machine where the Admin Agent is installed and the default <
port_number> is 8777.
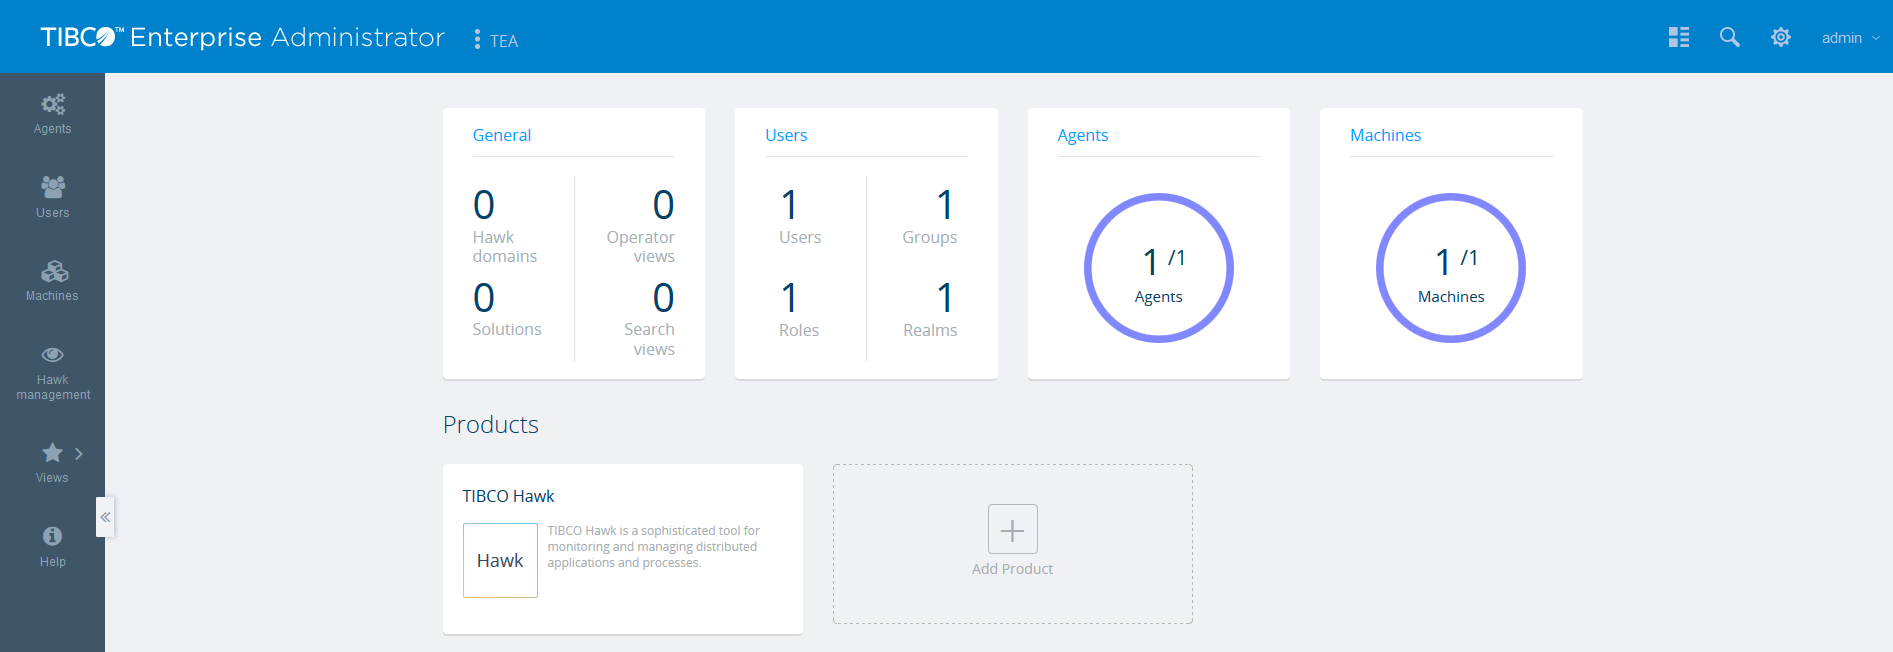
The left navigation bar contains some icons that are links to the various views in TEA. Refer to the
TIBCO Enterprise Administrator User’s Guide for more information on them.
|
•
|
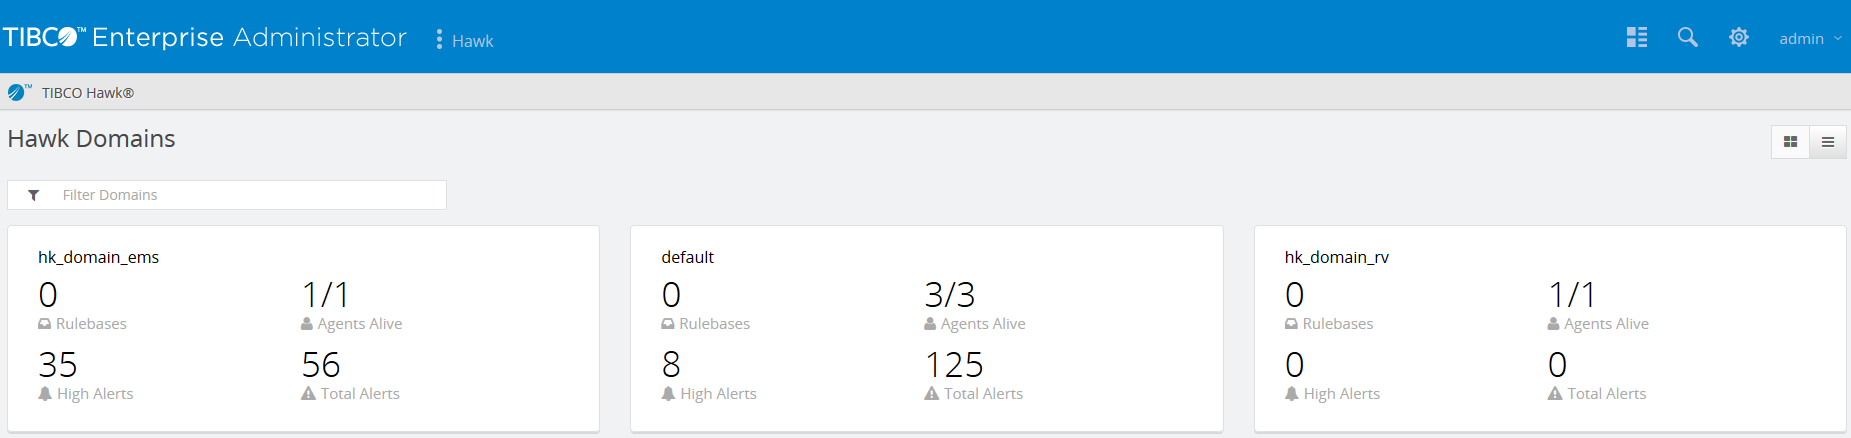
Rulebases: number of rulebases defined on the all agents in the domain
|
|
•
|
Agents Alive: number of agents that are up and in a running state out of the total number of agents that belong to the domain.
|
|
•
|
High Alerts: number of alerts with a ’ high’ status that are generated for all agents in the domain.
|
|
•
|
Total Alerts: total number of alerts generated for all agents in the domain.
|
|
•
|
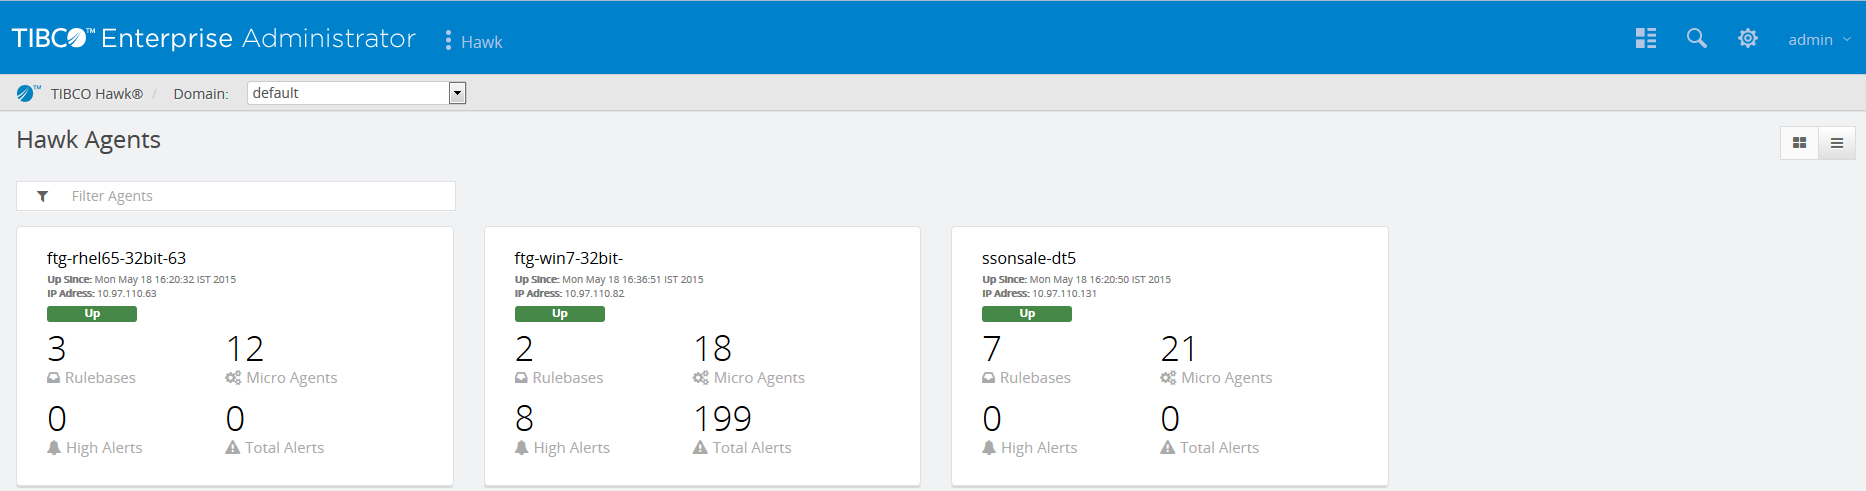
Up Since: the timestamp when the agent was started.
|
|
•
|
Rulebases: displays the number of rulebases defined on the agent.
|
|
•
|
Micro Agents: displays the number of Microagents for the agent.
|
|
•
|
High Alerts: displays the number of alerts with the status ’ high’ generated for the agent.
|
|
•
|
Total Alerts: the total number of alerts generated for the agent.
|
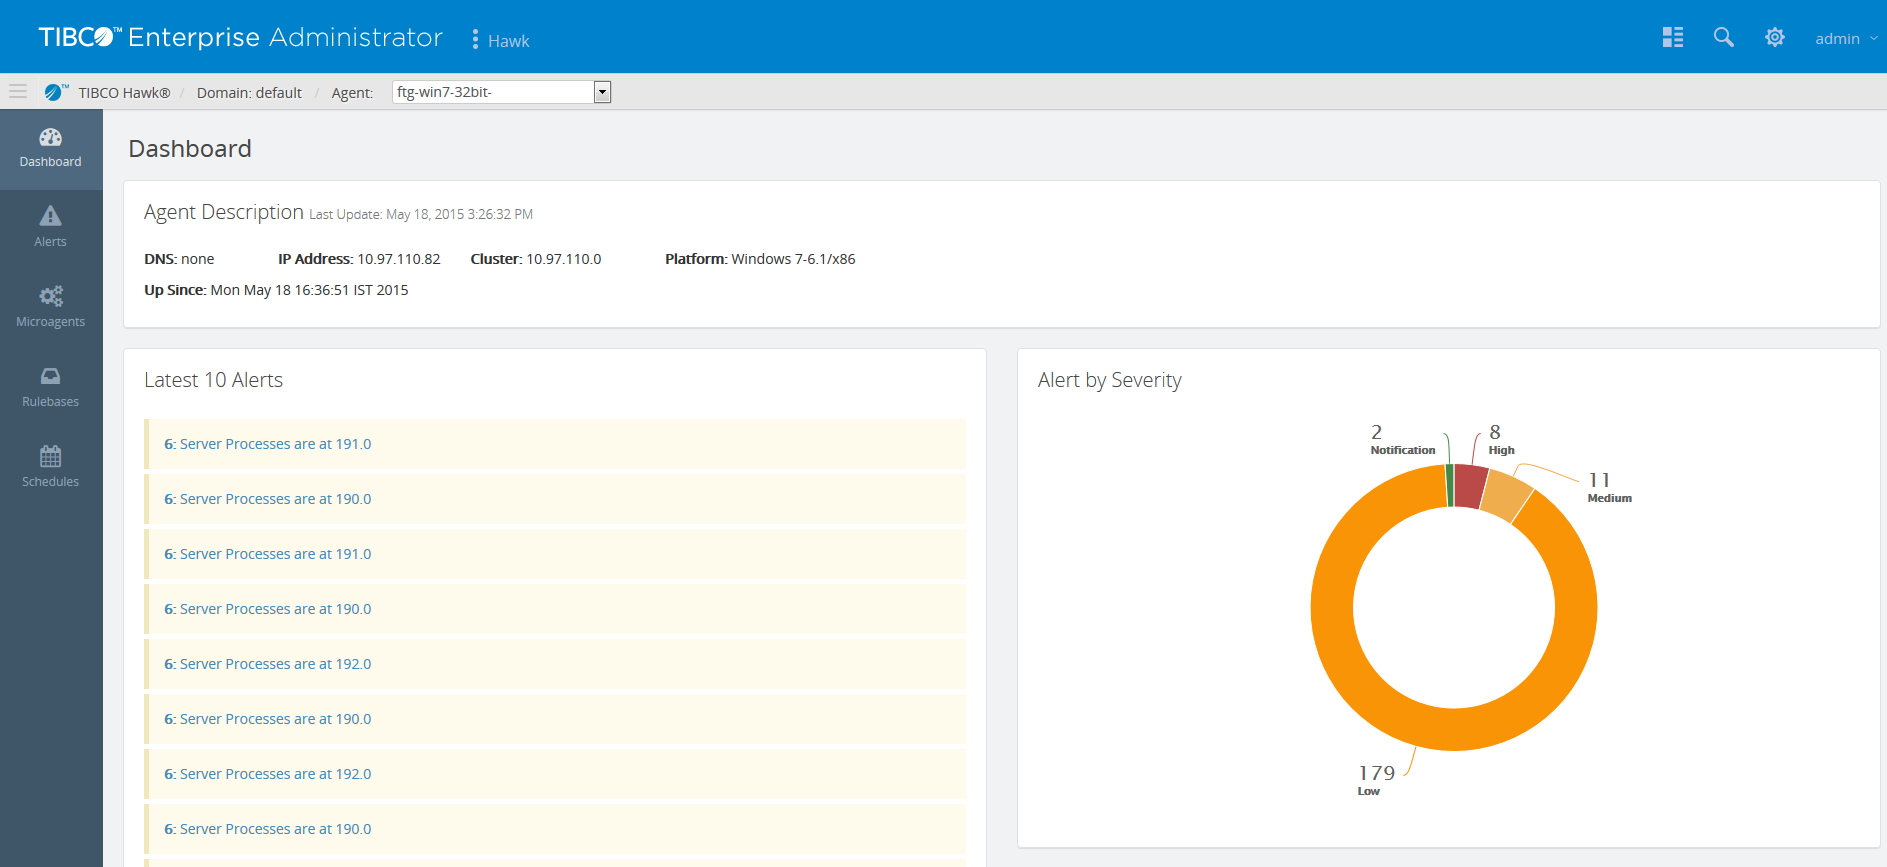
To get a detailed description of an agent, click anywhere on the agent card in the Hawk Agents page. The Agent Description page is displayed. You can also get to this page by clicking the Dashboard icon on the left panel.
The Agent Description page displays the alert list as well as a pie chart representation of alerts. It displays the following details about the agent:
|
•
|
Last Update: timestamp when the agent was last updated.
|
|
•
|
IP: IP address of the machine on which it is running.
|
|
•
|
Cluster: IP address of the cluster that the agent machine belongs to
|
|
•
|
Platform: Operating system installed on the machine on which the agent is running.
|
|
•
|
Up Since: Timestamp when the agent was started
|
|
•
|
Latest 10 Alerts: details of the last 10 alerts that were generated for the selected agent.
|
|
•
|
Alert by Severity: Displays a pie chart showing the number of High, Medium, Low and Notification status alerts.
|
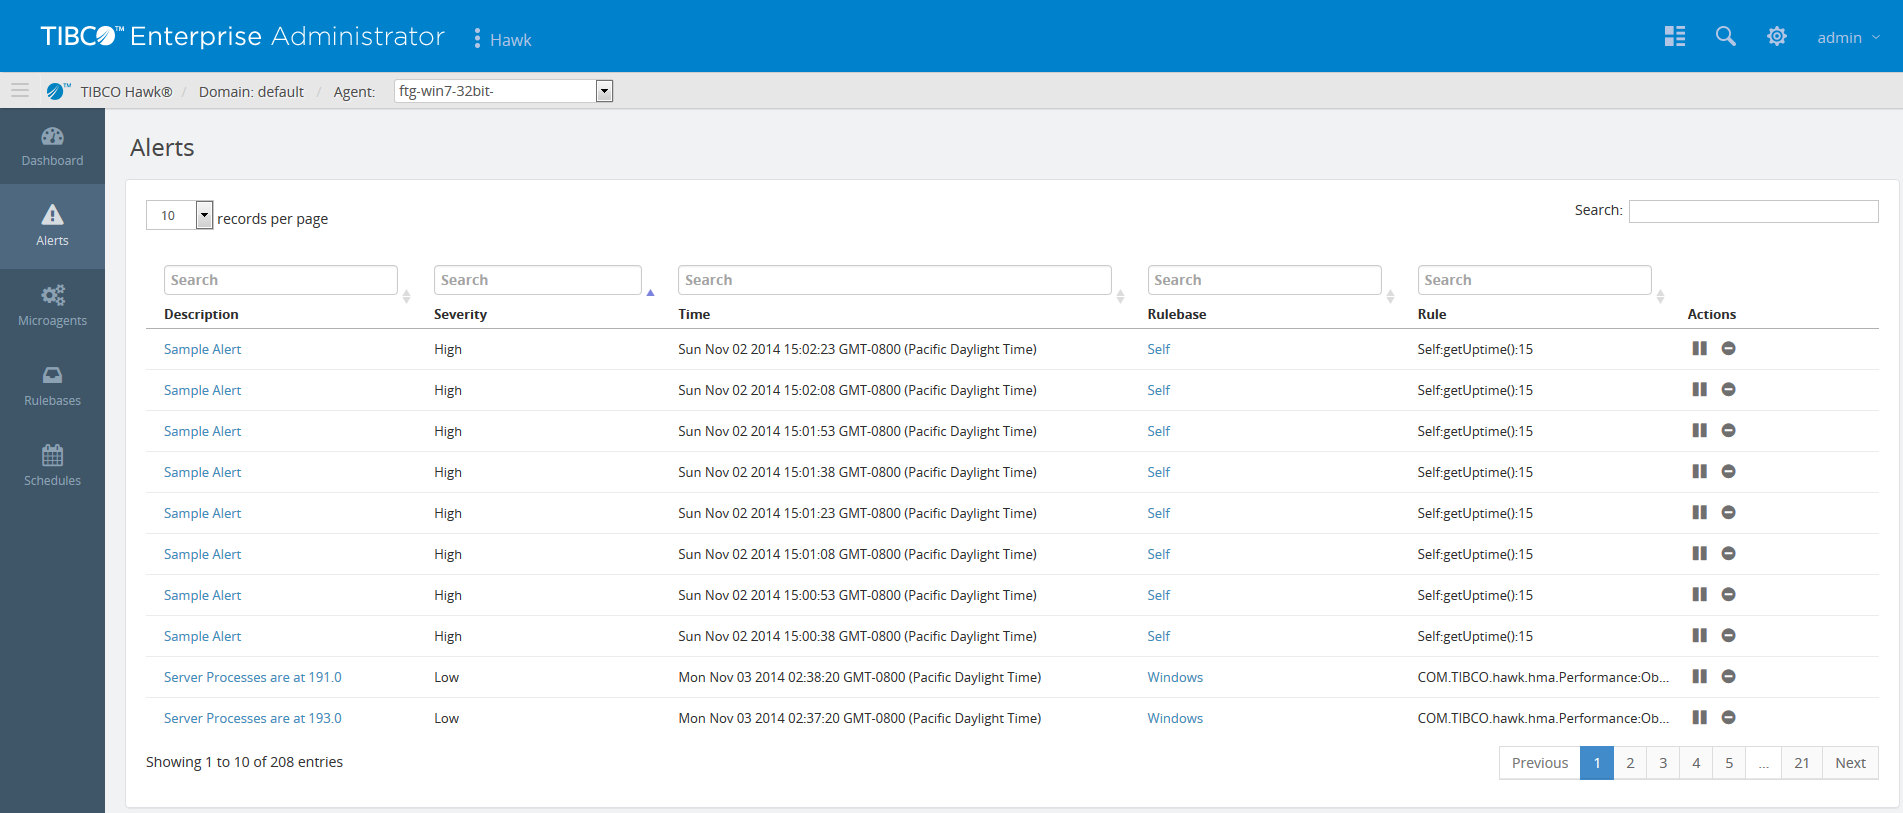
You can display 10, 25, 50 or 100 alerts on a page by selecting the number from the records per page drop-down menu. For each alert, the following details are provided:
|
•
|
Severity: type of severity which can be one of High, Medium, Low, or Notification.
|
|
•
|
Time: timestamp when the alert was generated.
|
|
•
|
Rulebase: name of the rulebase which generated this alert.
|
|
•
|
Rule: name of the rule that triggered the alert.
|
|
•
|
Actions: the action that you want to take on this alert. You can either Suspend (make it inactive) the alert for an specified amount of time or Delete it by clicking on the appropriate button in this column.
|
You can search individual columns by using the Search box above that column or to search across all columns use the stand-alone Search box located on the top right of the page.
To get the details of an alert or the details of the rulebase that triggered the alert, click its Description link or the Rulebase link. Alert details such as the Alert text and the Alert ID are displayed. Rulebase details such as the Rulebase name, its data source, the rule that triggered this alert, the rule description, action, and DataIndex are displayed.
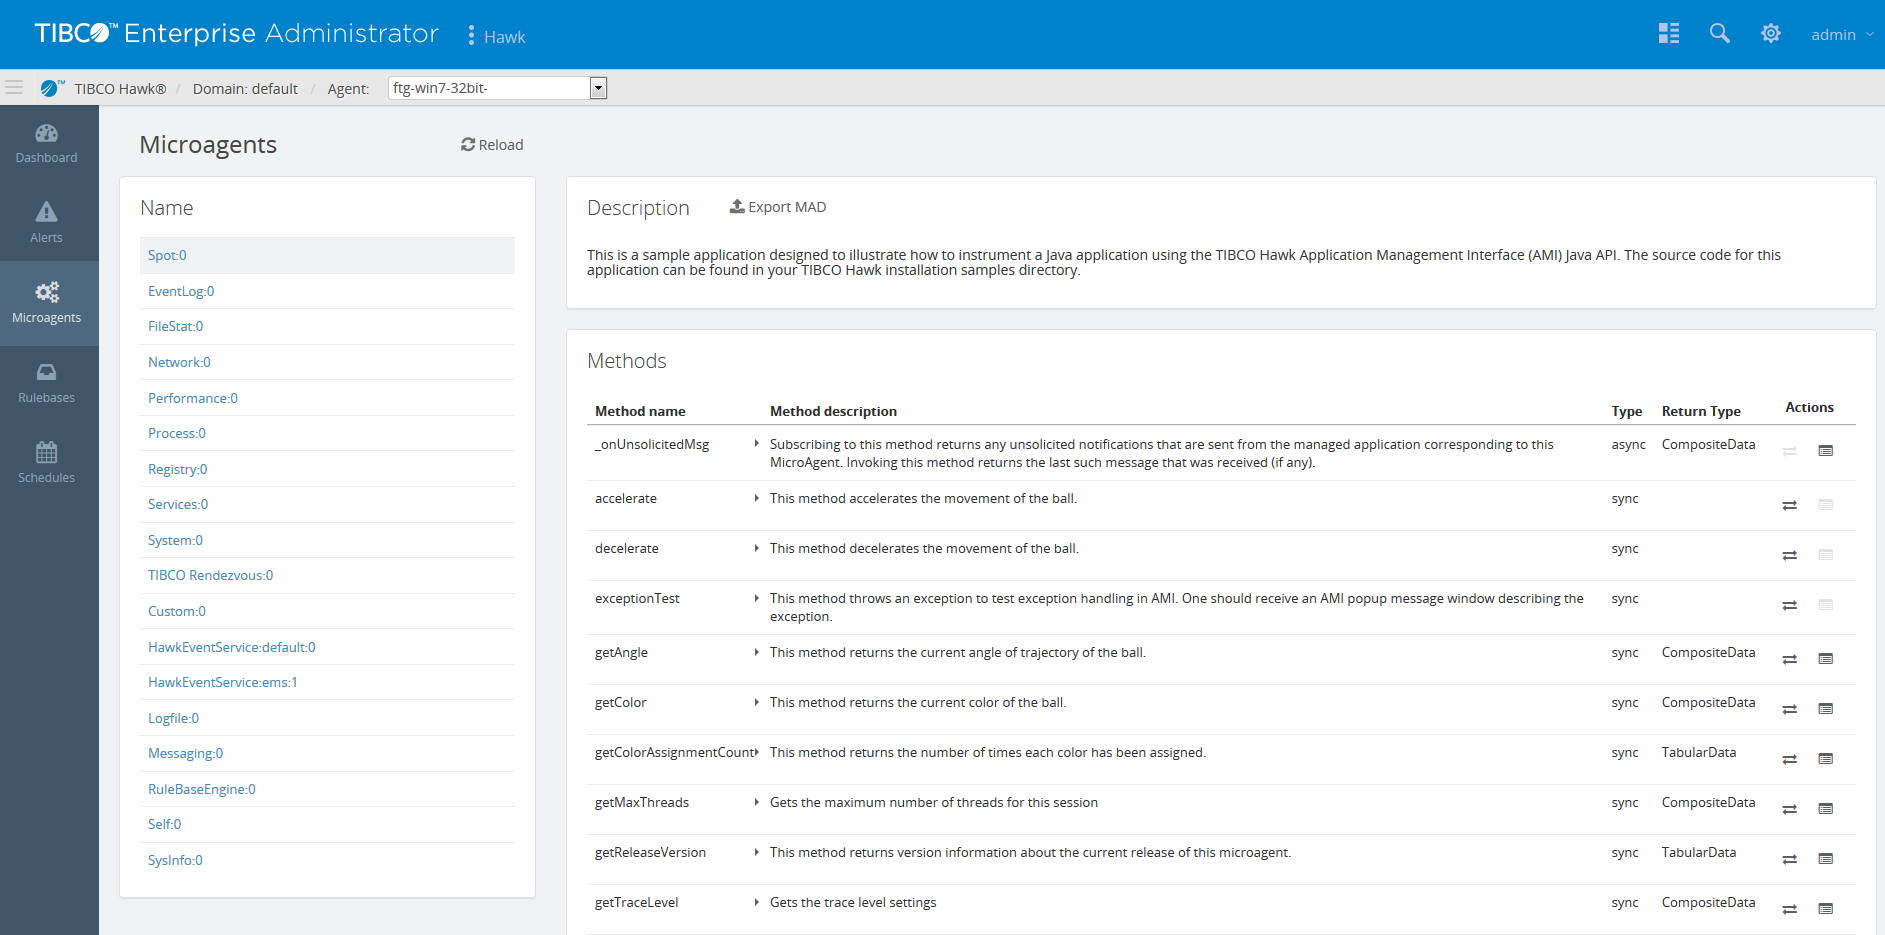
Each agent has a set of default microagents, that are discovered by agents when it is started. If you install and start an adapter or gateway, or instrument an application with AMI, microagents for these objects are dynamically added to the agent. When you click the Microagents icon, you can view microagents and their methods for any discovered TIBCO Hawk agents. For more details on microagents, see
TIBCO Hawk Concepts Guide.
Description: Displays the name and possibly some text describing the selected microagent. All the methods available for the selected microagent are displayed in a table in the panel beneath the description.
|
•
|
Type: Subscription information is returned either synchronously, on a regular time schedule, or asynchronously, when data becomes available.
|
|
•
|
Return Type: Data is returned as Tabular Data, or Composite data.
|
|
−
|
Invoke: Use the Invoke mode to immediately view the results. Invoking is useful when you want to test a method before using it in a rule, or to check a return value for troubleshooting purposes. This example demonstrates the Invoke mode of operation.
|
|
−
|
Subscribe: Use the Subscribe mode to view the microagent method results over time. Creating a subscription is useful when you want to test a range of return values before specifying boundaries in a rule, or to identify general patterns of activity.
|
You can either view or download the microagent description to a file. Click the Export MAD link in the Description panel and select whether you want to open it or save the file locally.
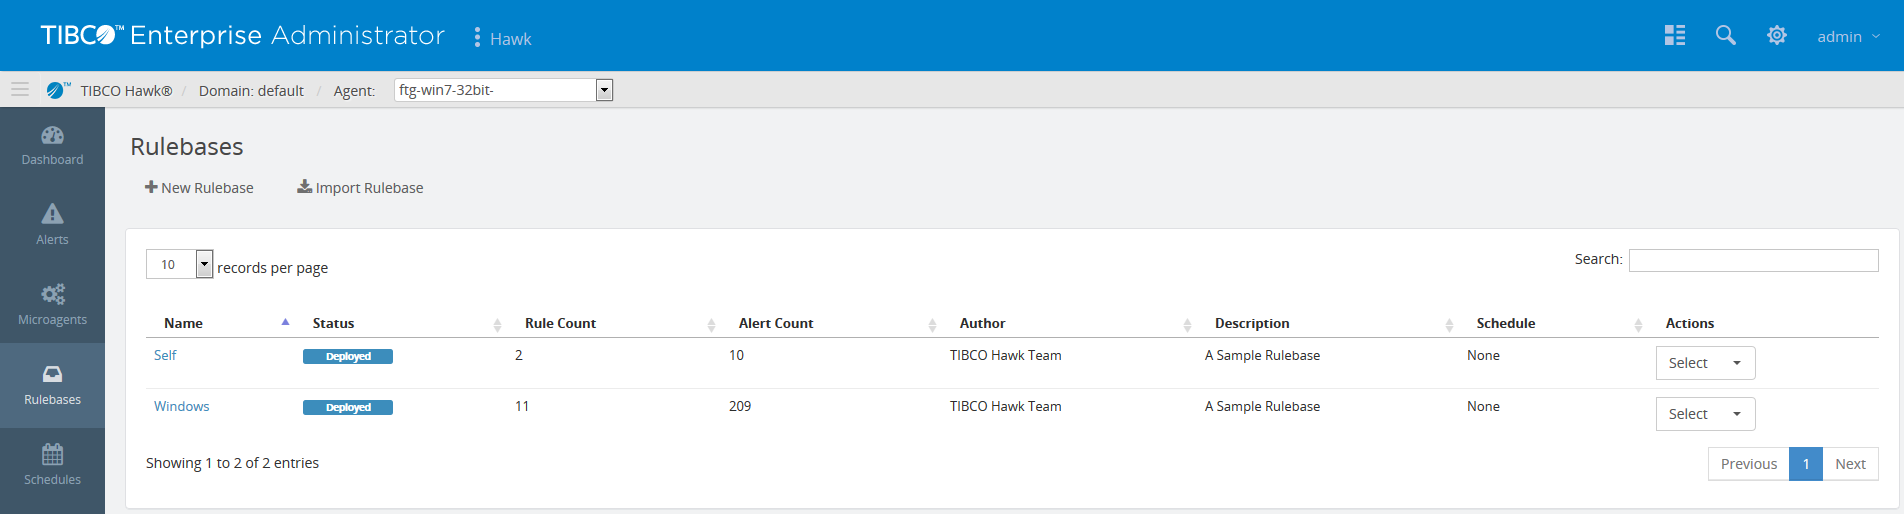
The Rulebases page shows all the rulebases for the agent. You can select the number of rulebases displayed on a page by selecting 10, 25, 50 or 100 from the
records per page drop-down menu.
Name: the name of the Rulebase
Status: whether the rulebase is deployed or undeployed
Rule Count: the number of rules in the Rulebase
Alert Count: the number of alerts generated by the Rulebase on the agent
Author: name of person or entity that created the Rulebase
Description: text used to describe the Rulebase
Schedule: the name of the schedule that is used by the Rulebase
Actions: you can take the following actions on the Rulebase:
Click on a Rulebase name to see the details of the Rulebase. The page for a specific Rulebase displays the details of the Rules in that Rulebase in addition to its author, description, schedule used, and alert count.
Microagent Name: name of the microagent that uses this rule
Method Name: name of the method to be invoked to retrieve data
Interval: interval in seconds between two subsequent method invocation
Schedule: schedule used by this rule
Actions: actions that can be taken on the rule are:
Edit Rulebase: edit or update name, description or schedules used in the Rulebase
New Rule: create a new rule in the Rulebase
Undeploy Rulebase: undeploy the Rulebase from the current agent
Get Alerts: get a list of the alerts that are generated by this Rulebase
Export Rulebase: export this Rulebase to a .hrb file on your local machine
Deploy To: deploy this Rulebase to other agents
Undeploy From: undeploy the rulebase from an agent on which it was previously deployed
|
1.
|
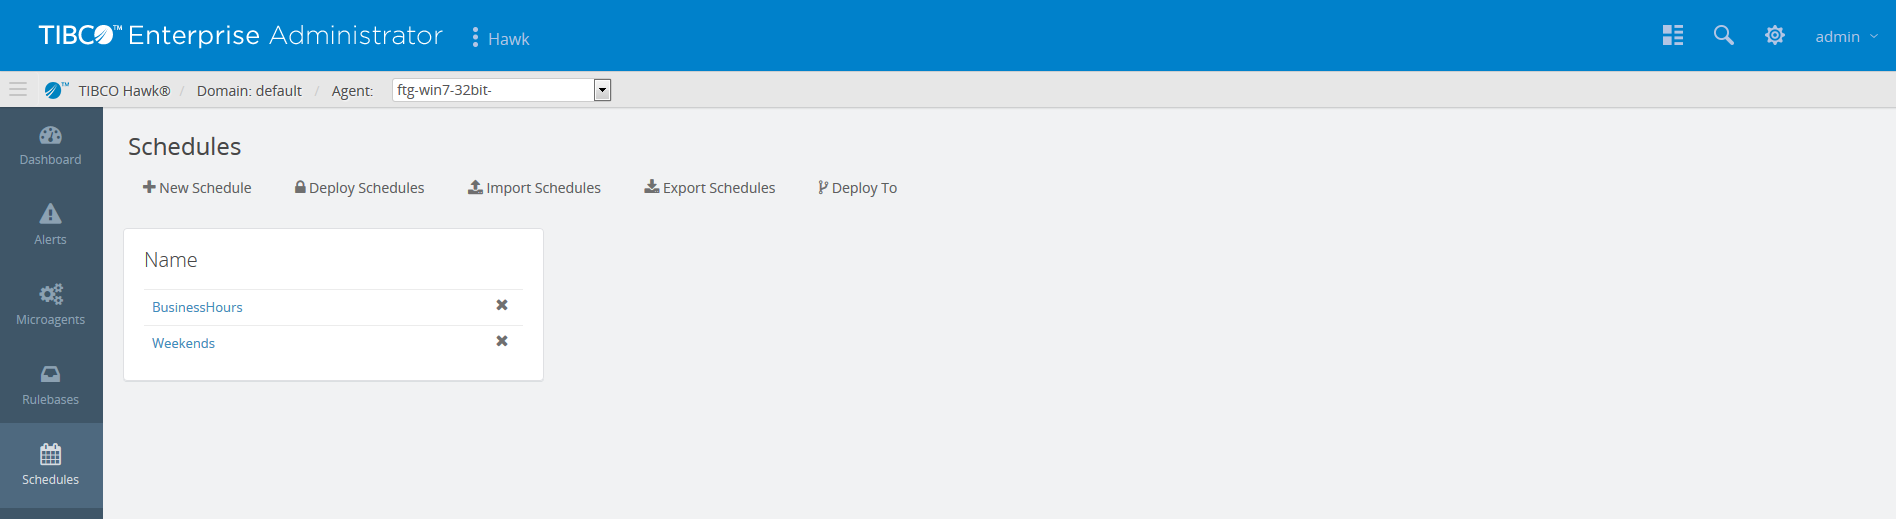
Click the Schedules icon in the left vertical pane. The Schedules page will open.
|
|
2.
|
Click the +New Schedule link to open the Schedule dialog.
|
|
5.
|
Click the +Save button. You should see your newly created schedule added on the Schedules page.
|
|
6.
|
Click the name of your new schedule. You can specify the time, day, month, and year for the schedule by clicking the + sign in the Inclusion Periods box to specify the time period when you would like the system to apply the rule or rulebases depending on whether the conditions are met. Likewise, you can do the same by clicking the + sign in the Exclusions Periods when you would like the system to ignore the rules or rulebases.
|
You can export your existing schedules to a .hsf file on your local machine by clicking the
Export Schedules link. This is helpful when you want to reuse the schedule on another agent. You can import your exported schedule into another agent by clicking the
Import Schedules link on the Schedules page of the agent. It will save you the effort of recreating the schedules.