Dashboard Tab
The Dashboard tab displays agent information and alerts information in a single view.
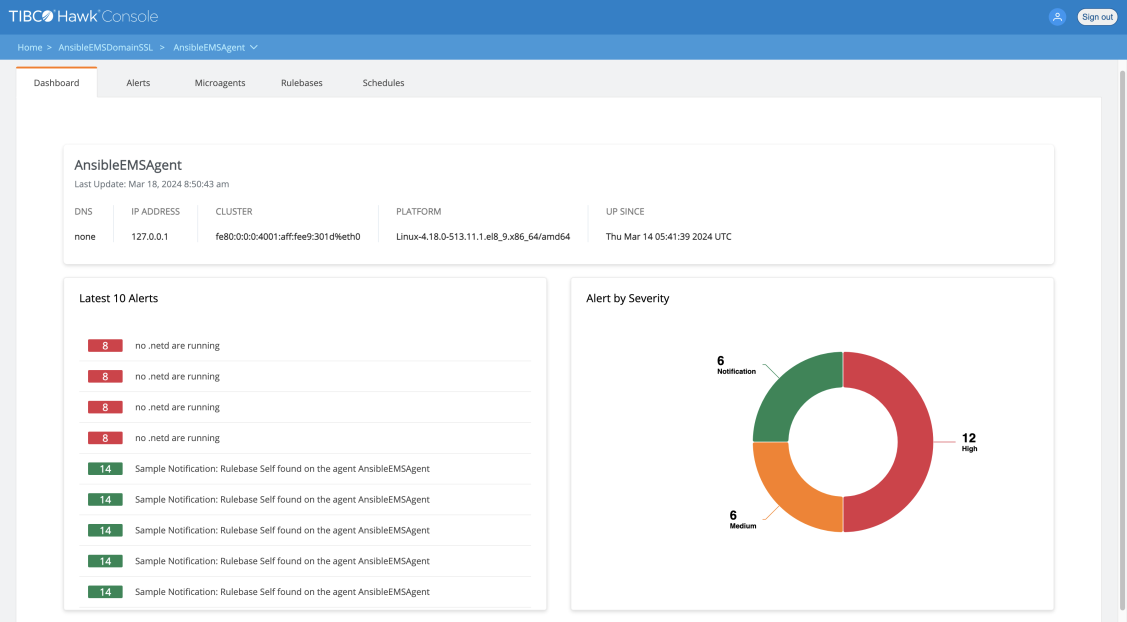
Figure 22: The Dashboard Page for the Hawk Agent
The following sections are displayed on the Dashboard tab:
| • | Agent Description - The section displays the infrastructure details of the Hawk agent. The following field values are displayed for the agent: |
| — | DNS |
| — | IP Address |
| — | Cluster |
| — | Platform |
| — | Up Since |
| • | Latest 10 Alerts - The section lists most recent ten alerts for the Hawk agent. |
| • | Alert by Severity - The section shows the doughnut chart for the alerts based on their severity. Each colored section denotes different severity. Click on any section of the doughnut chart to open the list of alert message of that severity. |