By using TIBCO LogLogic LX or MX or ST Appliance, you can view all the Compliance Suite reports for the device and run them as well as view the output data.
Procedure
Log in to your TIBCO LogLogic LX or MX or ST Appliance as admin.
From the navigation menu, select
Reports
> ISO or IEC 27002.
Note: You can also access all of your custom reports on the Appliance including the Compliance Suite reports you installed, by selecting
Reports
> All Saved Reports.
On the
Reports page, you can see all of the custom reports you loaded during the installation process.
You can navigate through all of the custom reports using the page navigation buttons at the top and bottom of the
Reports page.
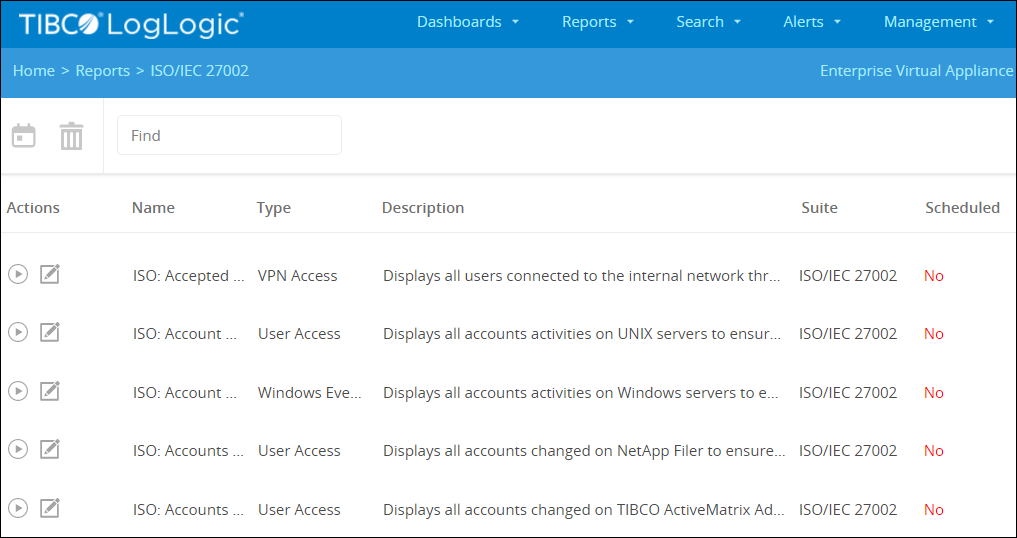
The following figure shows a cropped list of the Compliance Suite reports loaded from the ISO XML file.
Compliance Suite Reports
Click the
Edit button of a report to see details such as, the Appliance where the report runs, the associated device type, and when the report runs.
To view the filter parameters, click
Columns and Filters.
To view details about a report such as the report name and description, click
Properties.
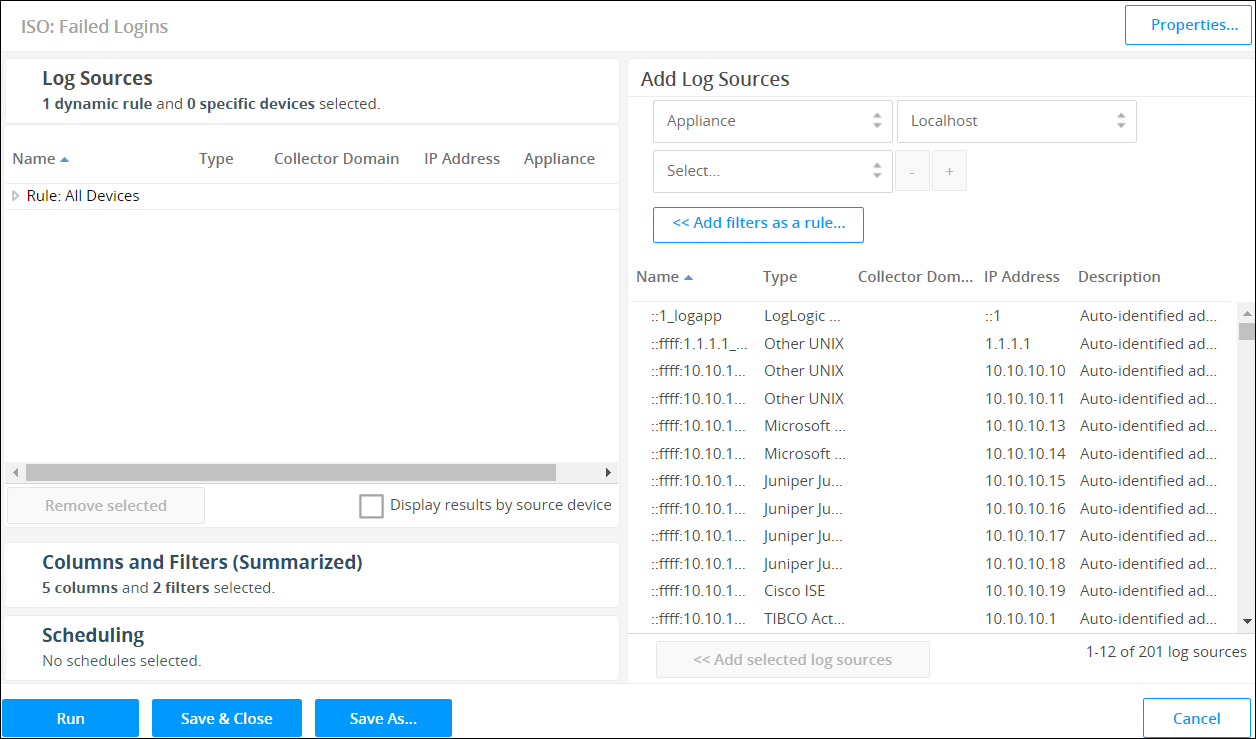
The following figure shows the details of the
ISO: Failed Logins report.
ISO: Logins Failed Report Details
Run the report to view the report output data by completing the following steps:
Click
Run.
The report runs and returns data based on the set parameters.
To view detailed drill-down information, click the
Count column link.
Note: You can use the
Back to summarized results button to return to the main data output view.
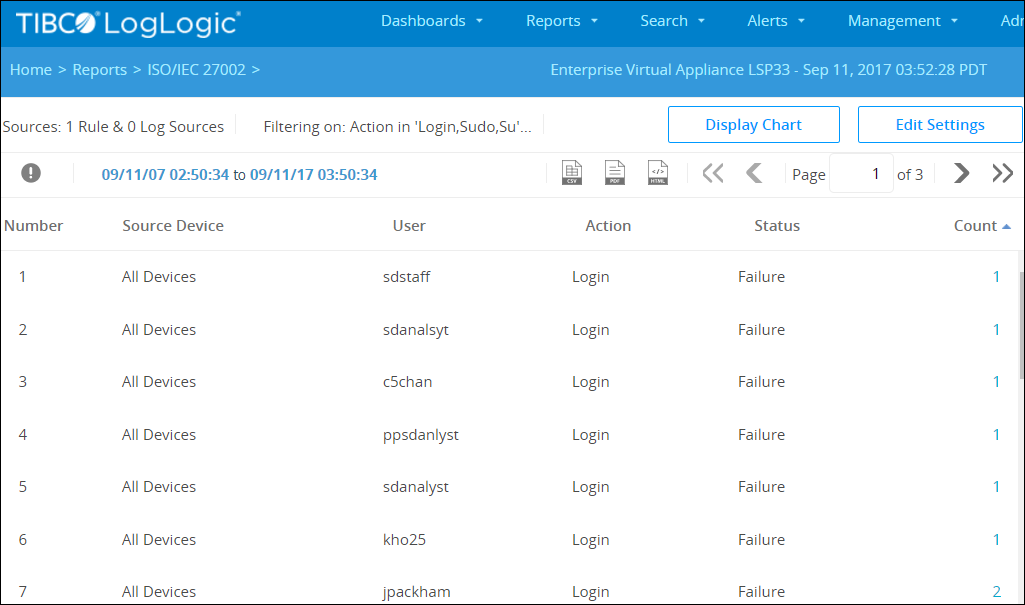
The following figure shows sample results from the
ISO: Logins Failed
report.
ISO: Logins Failed Report Results
Note: If you want to modify the main data output view, you can modify the report parameters and then run the report again.