After you have enabled at least one alert, and that alert is triggered, you can view the results.
For more information on how to use and modify alerts, see to the
TIBCO LogLogic® Log Management Intelligence (LMI)User Guide.
Procedure
In the navigation menu, select
Alerts
> Show Triggered Alerts.
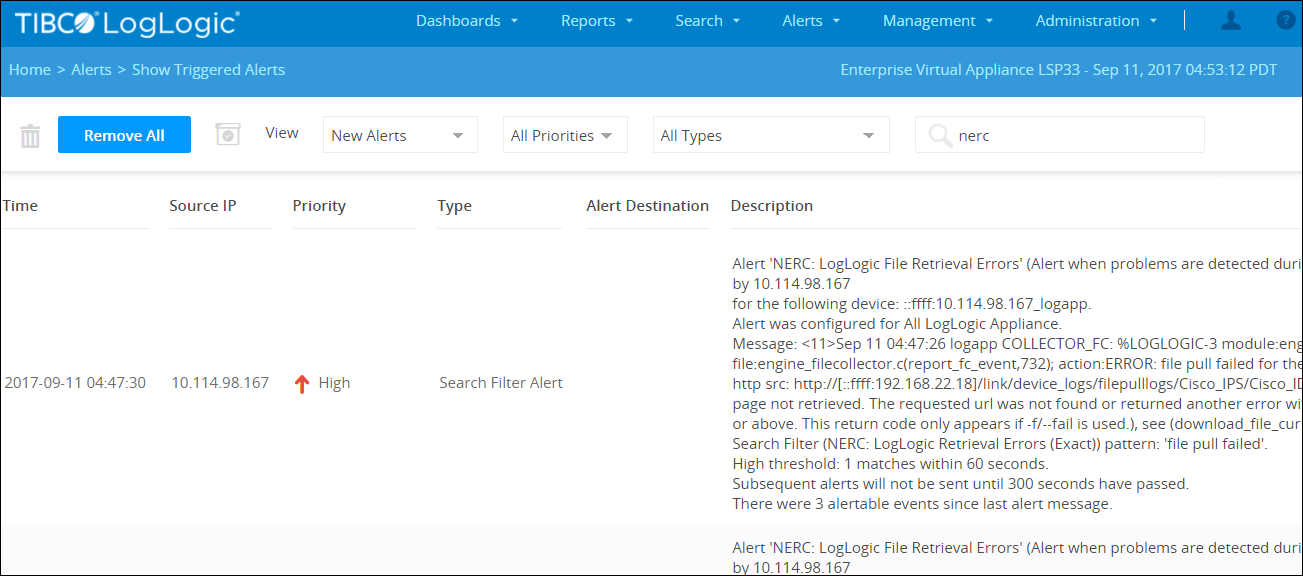
The following figure shows a cropped version of the
Show Triggered Alerts page.
Aggregated Alert Log
From the
Show menu, select the desired alert and priority filters to show only those alerts you want to display. The defaults are
New Alerts and
All Priorities.
(Management Station Appliances Only) From the
From Appliance drop-down menu, select the Appliance from which you want to view the alerts.
The results of your query are displayed. You can navigate through all of the data by using the page navigation buttons or page text field.
You can either acknowledge or remove an alert. Click the check box next to the alert name, then click
Acknowledge,
Remove, or
Remove All.
Note: Each alert is triggered based on your set alert parameters, so care must be taken when acknowledging or removing the alert.
For more information on how to use and modify alerts, see to the
TIBCO LogLogic® Log Management Intelligence (LMI) User Guide
.