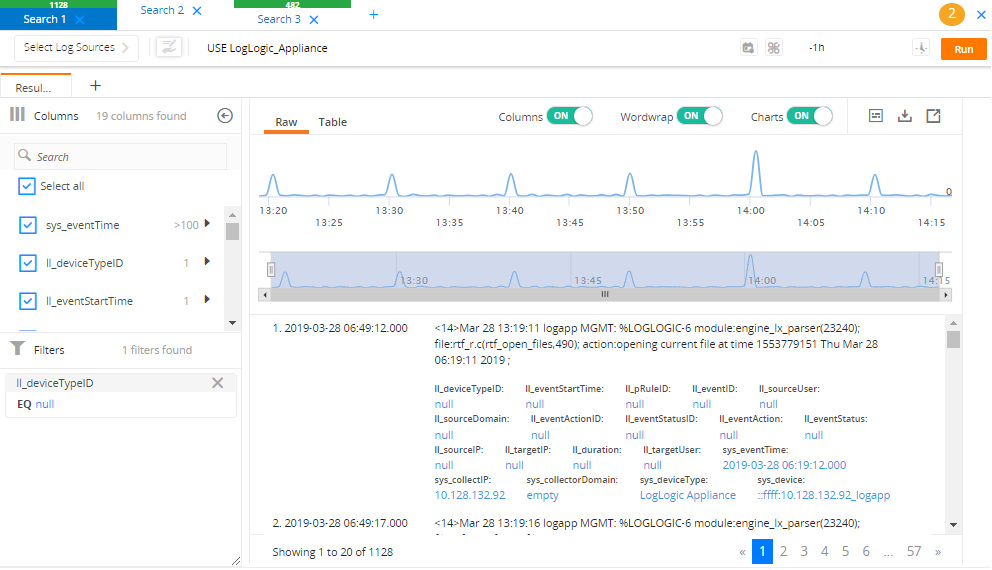
Search Results
After running a search query, you can view search results in the Result tab.
You can visualize results using Timeline Charts or Data panel. After running a query, if you retrieve lots of results, you can group the results without having to issue a new query, and then drill-down into the information. You can see both aggregated counts as well as create visualization elements to better isolate trends and issues. You can include multiple filters to narrow your results. Create a filter in the context of an event, and view results based on a specific filter.
After clicking Run, a progress bar is displayed above the search tab name showing the progress of the query. Based on your data, it might take a few minutes to retrieve results into all panels. By default, results are returned in ascending order. After the query is run, the number of results is displayed above the tab name. Twenty results are displayed per page. You can jump to other pages using the pagination controls at the bottom of the panel.
If you use a GROUP_BY clause in the query, you can save the query as an aggregation rule by clicking the
![]() icon.
icon.
Querying a large data set using Advanced Search might display an error or an exception if the result contains more than a few million records.
Click
![]() to add multiple result tabs to view the same data in different forms. When results are grouped together, a new
Result tab is displayed showing the grouped results for the selected value.
to add multiple result tabs to view the same data in different forms. When results are grouped together, a new
Result tab is displayed showing the grouped results for the selected value.
The Result tab is divided into the following panels:
- Data display data in raw format and normalized tabular format on the Raw data and Table tabs within the panel.
- Columns provide all available columns and their associated values based on each search query. You can turn the Columns view off by using the switch on the top of the panel.
- Timeline Charts display the distribution of events in time using a line chart at the top of the panel. The Timeline Charts view is on by default. You can turn the view off by using the slider at the top of the panel.
- Filters displays the filters you have used in the results. You can filter the search results based on time range or column values. You can also edit the filter values.