Viewing trends over time
Procedure
-
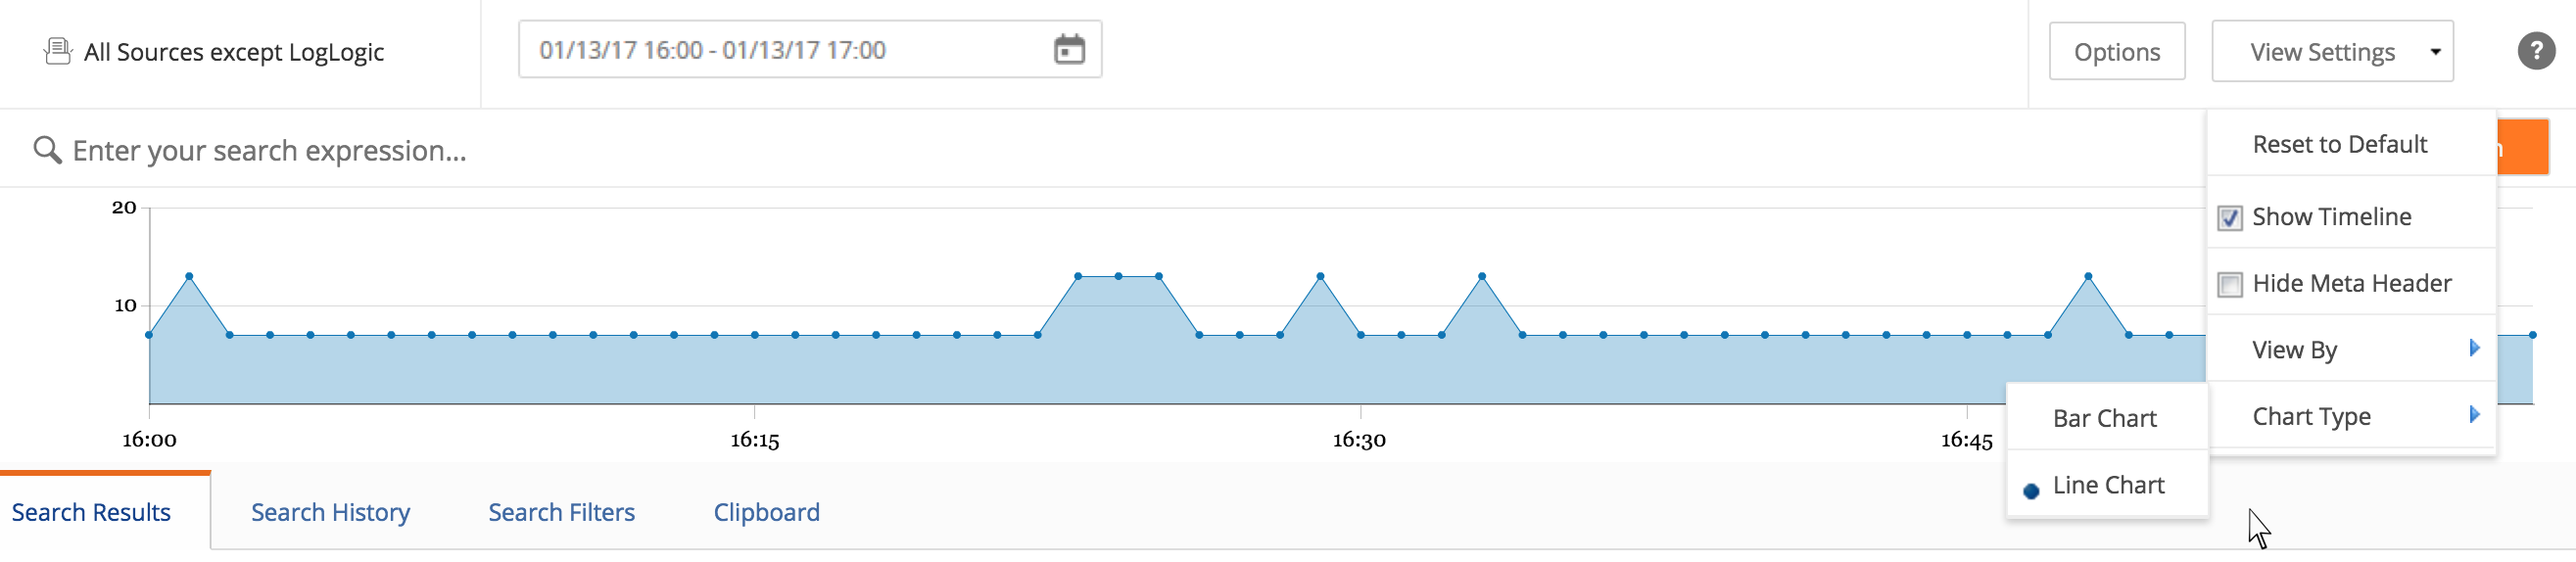
Click the
View drop-down menu and then select the
Show Timeline checkbox.
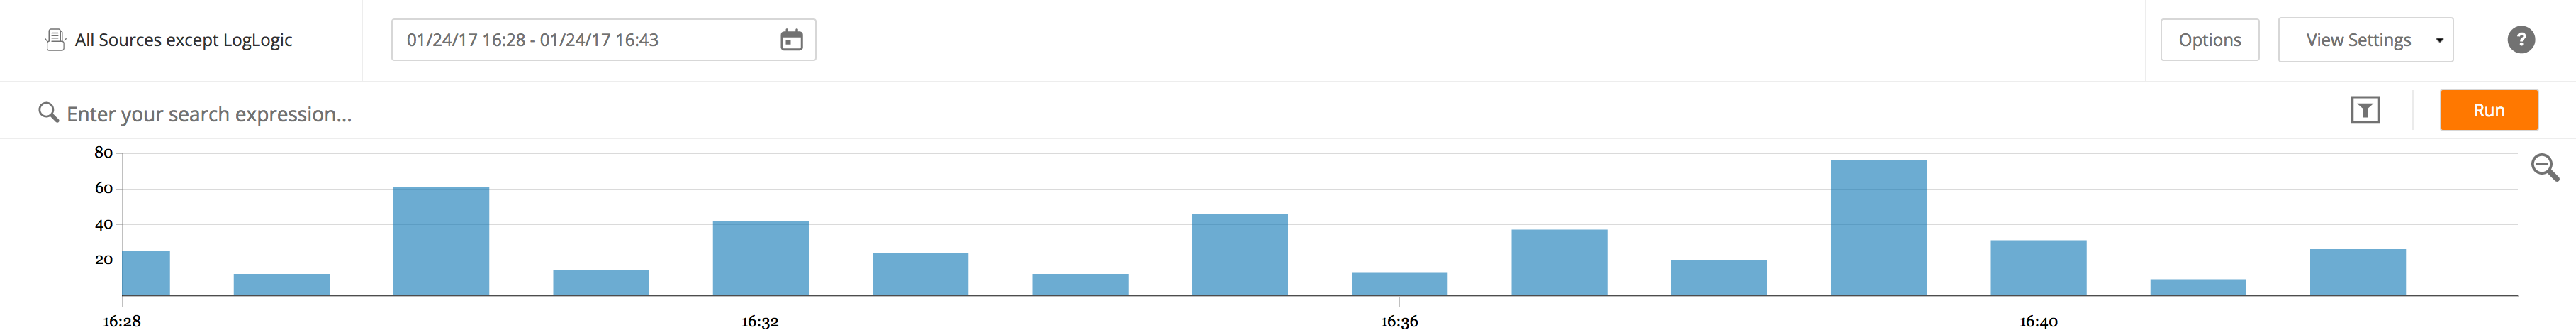
A timeline chart is displayed below the search text box. You can immediately see the distribution of messages over time and begin to get a sense of trends in the timeline chart.
By hovering the mouse over an affected bar, you can get the total number of messages matching your search expression at that particular point in time.
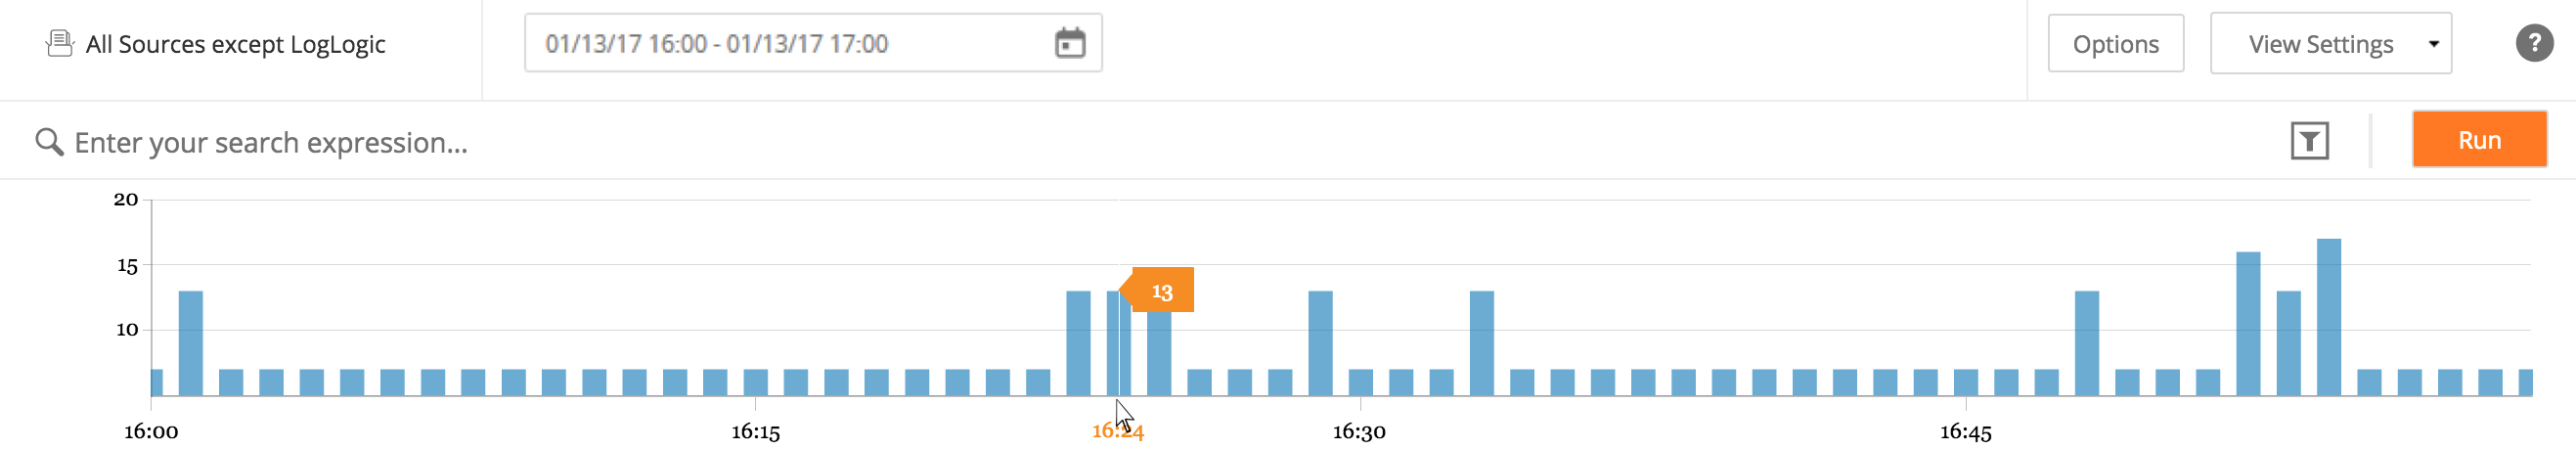
For example, in the following figure you can see that 13 log message instances at 04:24 in the evening. The scale on the x-axis shows the total number of messages while the y-axis shows the time distribution of those instances.

Copyright © Cloud Software Group, Inc. All rights reserved.