This widget uses one column at a time.
Each pie slice represents a distinct column value. The Pie widget data varies based on the selected column. Values that are not displayed in the specified the number of slices are grouped together into the 'Others' slice.
| Field
|
Description
|
| Query
|
Enter a search query. Enter USE to start an EQL statement and SELECT to start an SQL statement. You can search based on filter and time Bloks as well.
|
| Time
|
You can enter absolute and relative time ranges. Click
 to open a window that allows you to define a time range. For example, enter -5h to display results that occur in the last 5 hours. to open a window that allows you to define a time range. For example, enter -5h to display results that occur in the last 5 hours.
|
| Slice name
|
Define the column name. If the column name is already defined in the search query, the Slice name column is auto-populated. Otherwise, as you start typing in the field, the available matching column names are displayed. Choose the column name to define the slice of the pie.
|
| Slice value
|
The slice value of the pie.
|
| Show up to
|
Enter the number of slices to be displayed on the pie. If the slices are more than this number, they are combined and shown as 'Others'. For example, if number of slices is 5 and the value of
Show up to is 3, then the third, fourth, and fifth slices are combined and shown as 'Others'.
|
| Auto refresh
|
Click the slider to ON to refresh the widget. By default, it is set to OFF.
|
| Refresh widget
|
Enter a time interval to refresh the widget. Refresh action starts after the data is completely retrieved and displayed.
|
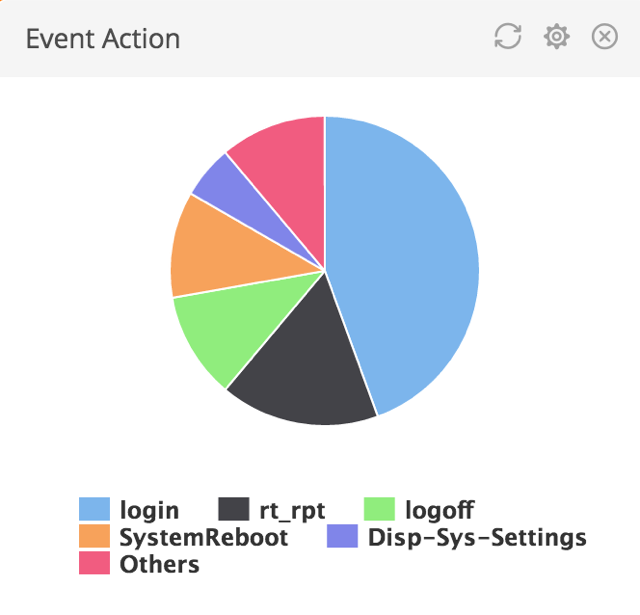
For the search query:
use LogLogic_Appliance | GROUP BY ll_eventAction | COLUMNS ll_eventAction AS EventAction, count(*) AS EventCount | (ll_eventAction IS NOT NULL)
the Slice Name is
EventAction, and the Slice Value is
EventCount
The following is an example of a Pie widget: