Treemap Widget
This widget is used to visualize various thresholds in the form of a colored treemap.
The treemap widget is useful to view thresholds such as CPU, memory, indexer, and disk thresholds. You can visualize if some factors in the system have issues or are normal.
Examples
For the search query:
use LogLogic_Appliance | GROUP BY ll_eventStatus, ll_sourceIP | COLUMNS ll_eventStatus, ll_sourceIP, count(*) as count | ll_eventStatus is NOT NULL | (ll_eventStatus != '')
the Tile Name is ll_eventStatus, and the Tile Value is count(*).
The following is an example of a treemap widget using the Color Axis value:
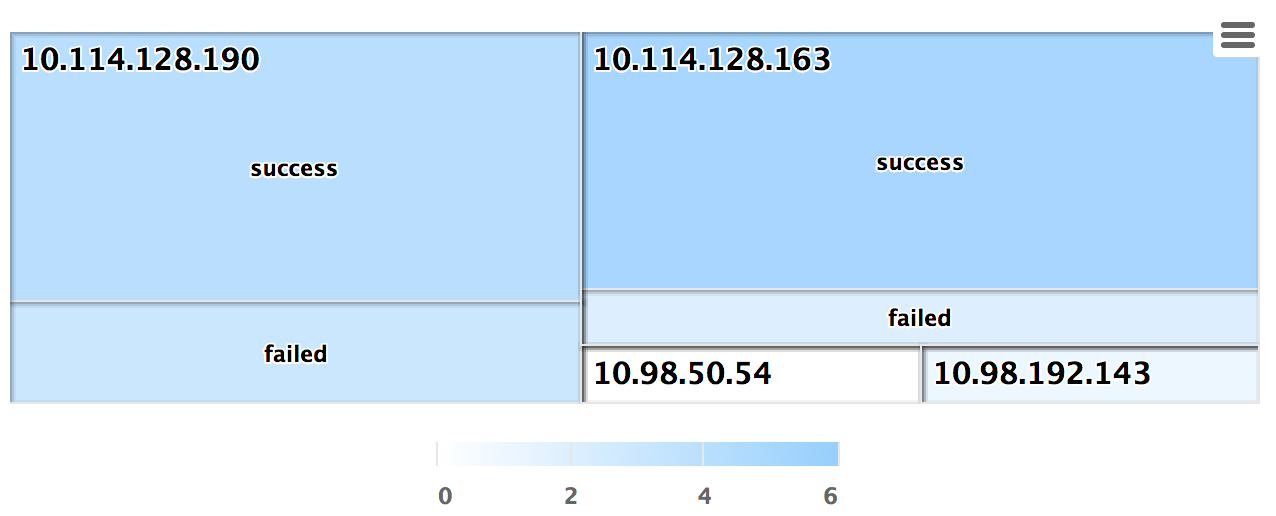
The following is an example of a widget using Color Axis with Categorize By ll_sourceIP: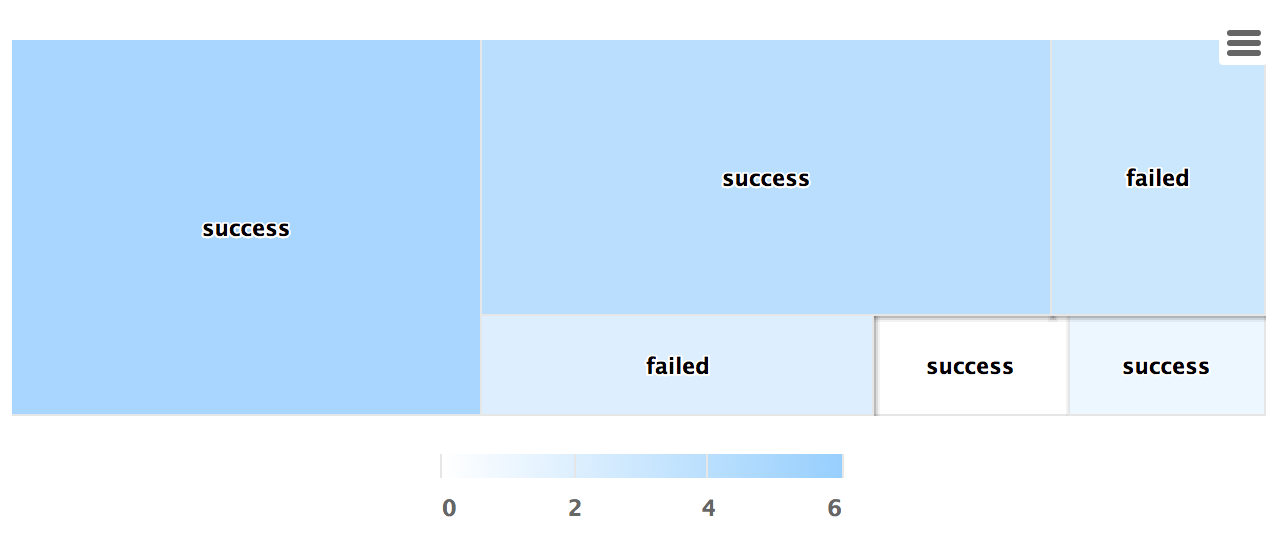
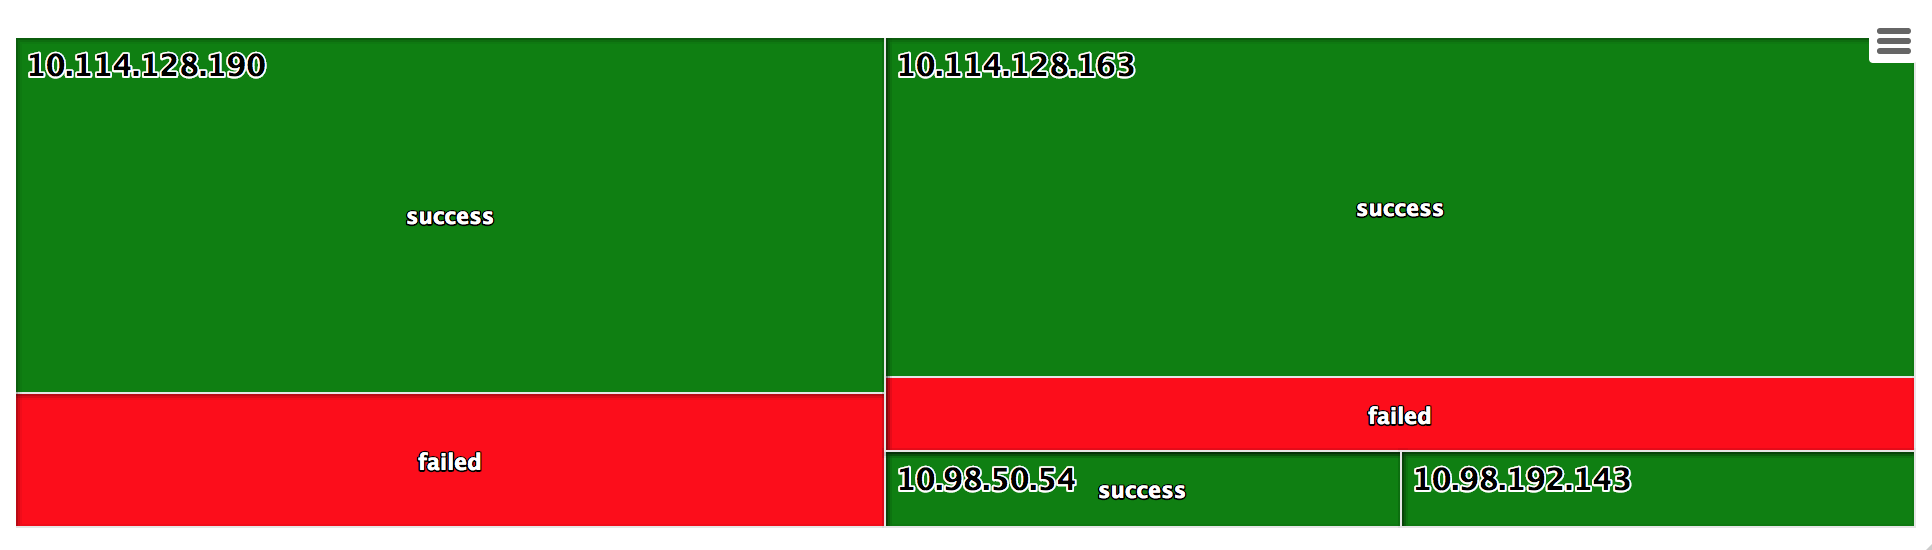
For the search query
use LogLogic_Appliance | GROUP BY
ll_eventStatus, ll_sourceIP | COLUMNS ll_eventStatus, ll_sourceIP,
count(*) as count, IIF(ll_eventStatus ='failed', 'red', 'green') AS
color | ll_eventStatus is NOT NULL | (ll_eventStatus != '')
using the color value column as color (from the query) and Categorize By ll_sourceIP:
Copyright © Cloud Software Group, Inc. All rights reserved.