| Query
|
Enter a search query. Enter USE to start an EQL statement or SELECT to start an SQL statement. You can search based on filter and time Bloks as well.
|
| Date & Time
|
You can enter absolute and relative time ranges.
For example, enter -5h as a relative time range to display results that occur in the last 5 hours.
|
| Column(s)
|
Column value of the selected field is used to plot the widget.
|
| Options
|
Select the required options to display in the widget result:
- Show Row Numbers
- Show Table Header
- Hide Column Separator
- Enable Context Menu
- Enable CSV Export
- Enable Excel Export
Even if you select the Enable CSV Export or Enable Excel Export options, the relevant menu options are available in the Filter menu only if the Enable Context Menu option is also selected.
|
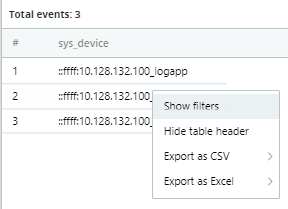
| Filter menu
|
This menu is available only if Enable Context Menu is selected in the
Options field.
If Enable Context Menu is selected in the
Options field, the following options are available after right-clicking the widget:
- Show/Hide filters
- Show/Hide table header (if the Show Table Header option is also selected in the
Options field)
- Export as CSV - all data or selected data (if the Enable CSV Export option is also selected in the
Options field)
- Export as Excel - all data or selected data (if the Enable PDF Export option is also selected in the
Options field)
|
| Buffer size
|
The number of rows to be displayed in the DataGrid after refreshing the widget. For example, if the buffer size is 100 and the query returns 150 results, the latest 100 results are displayed.
The default is 1000 rows.
|
| Auto refresh
|
Click the slider to ON to refresh the widget. By default, it is set to OFF.
|
| Refresh widget every
|
If Auto refresh is set to ON, enter a time interval in seconds to refresh the widget. Refresh action starts after the data is completely retrieved and displayed.
|