Generating a Report: An Example - Denied Connections Report
This example shows how to generate a Network Activity report that displays denied connection activity related to the IP addresses you select.
Procedure
-
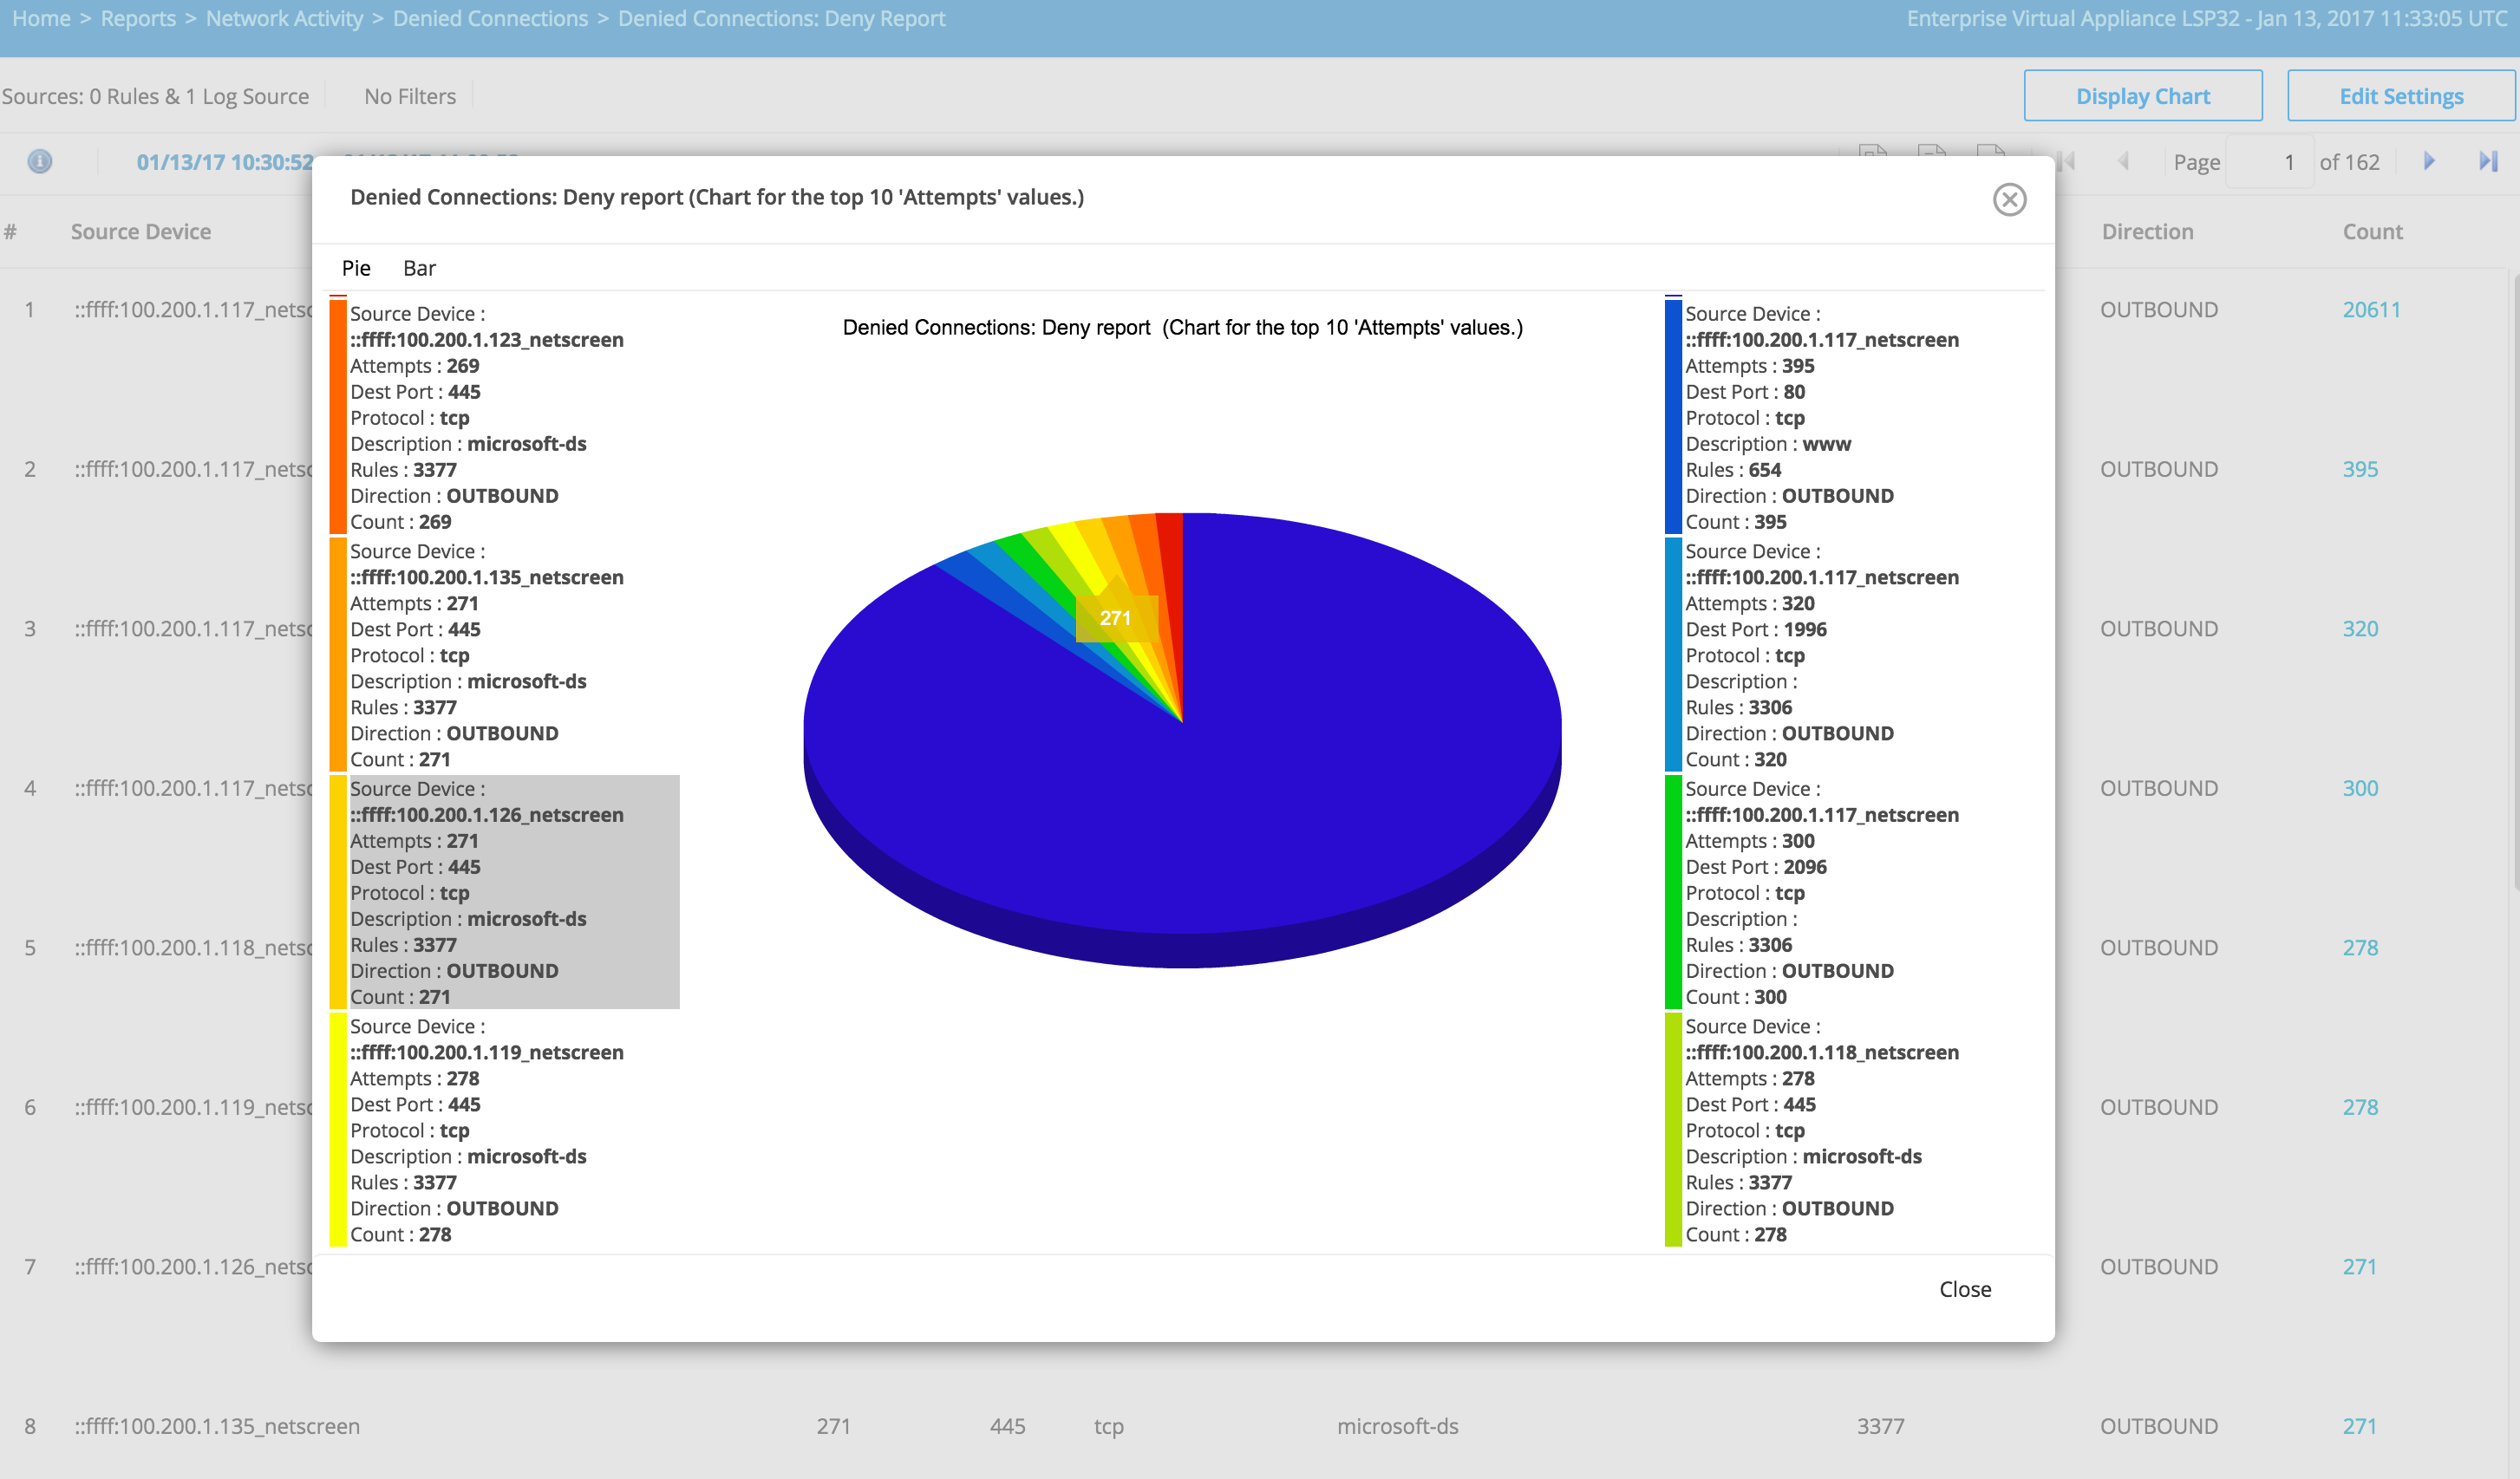
Select
Display Chart to graph the Denied Connections results. Pie chart and bar chart options are available. Move the mouse pointer over the chart segments highlights the results.
Note: The charts are populated based on column that is used as a data source. For example, Denied Connections: On Demand (Chart for: Attempts); where Attempts is the column name that is used as a data source for the chart. If you need to display a chart based on different column, you must sort the report by the column, and the column must have numeric values.
Copyright © 2020. Cloud Software Group, Inc. All Rights Reserved.