Treemap Widget

This widget is used to visualize various thresholds in the form of a colored treemap.

The treemap widget is useful to view thresholds such as CPU, memory, indexer, and disk thresholds. You can visualize if some factors in the system have issues or are normal.
Field Description
Query Enter a search query. Enter USE to start an EQL statement or SELECT to start an SQL statement. You can search based on filter and time Bloks as well.
Date & Time You can enter absolute and relative time ranges.

For example, enter -5h as a relative time range to display results for events that occur in the last 5 hours.

Tile Name Define the column name. If the column names are already defined in the search query, the Tile Name column is automatically filled. Otherwise, as you start typing in the field, the available matching column names are displayed.
Tile Value Define the column name by which the treemap tile is to be represented. The value of this column is used for the size of the tile.

If the column names are already defined in the search query, the Tile Value column is automatically filled. Otherwise, as you start typing in the field, the available matching column names are displayed.

Categorize by Define the column name by which the Y-axis data is combined into a series.
Use Color Axis In the Min Color and Max Color fields, specify the range of minimum and maximum values of the color to be represented on the axis.

The color axis needs to be adjusted to get the right color spread for the tile values.

Use Color Value Define the column name by selecting the column. The color represented by the Use Color Value field is used to color the tiles on the chart.

You can use Enrichment List or EQL Conditional functions such as IIF in the query to return specific color values.

If this field is specified, the Use Color Axis field is ignored.
Widget description A short description for the widget. On the Advanced Dashboard, the description is displayed when you hover over the widget.
Auto load Click the slider to ON to automatically load widget data on the Advanced Dashboard.
  • By default, it is disabled for newly created widgets, but enabled for the widgets created in LogLogic LMI 6.3.0 and earlier.
  • Disabling the Auto load option disables the Auto refresh option. However, you can manually refresh the widget on the Advanced Dashboard to load its data.
Auto refresh Click the slider to ON to refresh the widget. By default, it is set to OFF.
Refresh widget every If Auto refresh is set to ON, enter a time interval in seconds to refresh the widget. Refresh action starts after the data is completely retrieved and displayed.
Note: Clicking the widget opens Advanced Search with the same query that you used for the widget.

Examples

For the search query:
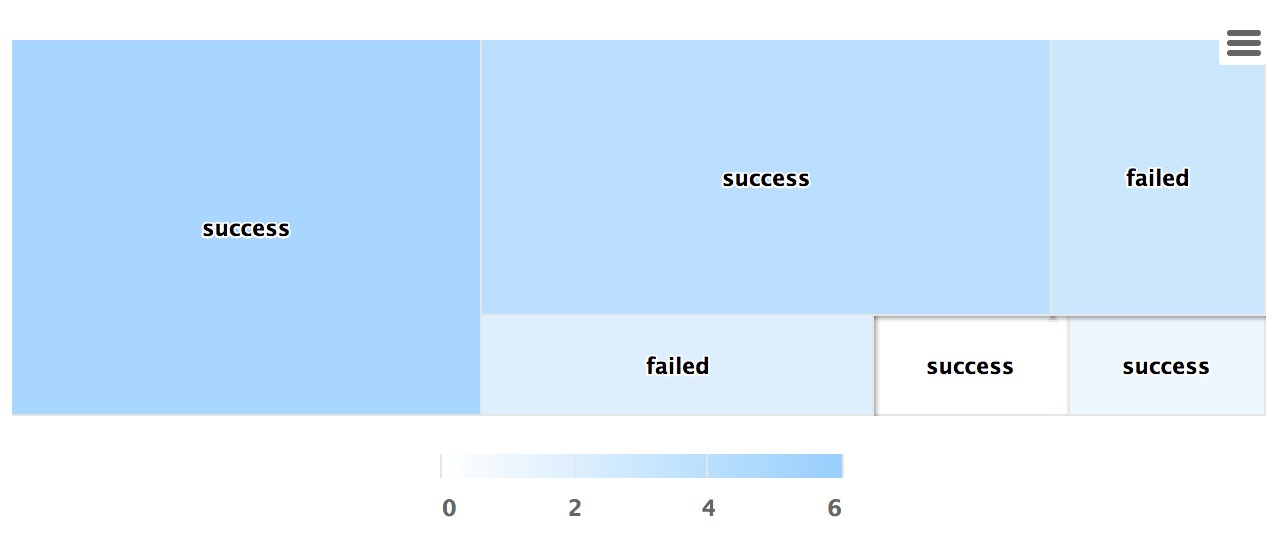
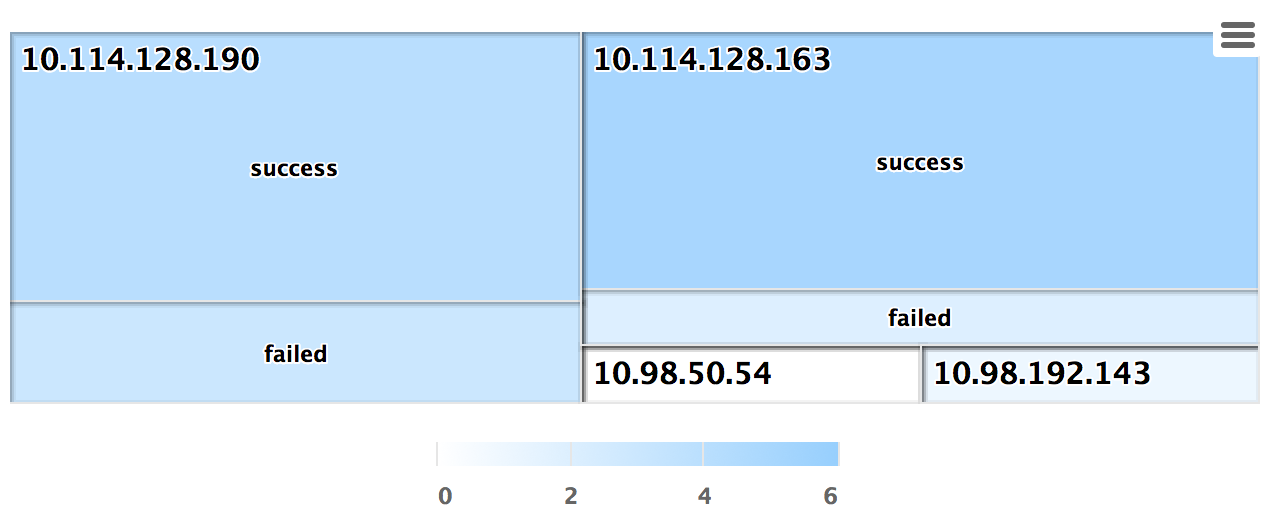
use LogLogic_Appliance | GROUP BY ll_eventStatus, ll_sourceIP | COLUMNS ll_eventStatus, ll_sourceIP, count(*) as count | ll_eventStatus is NOT NULL | (ll_eventStatus != '')
the Tile Name is ll_eventStatus, and the Tile Value is count(*). The treemap widget using the Color Axis value:
The widget using Color Axis with Categorize By ll_sourceIP:
For the search query
use LogLogic_Appliance | GROUP BY
ll_eventStatus, ll_sourceIP | COLUMNS ll_eventStatus, ll_sourceIP,
count(*) as count, IIF(ll_eventStatus ='failed', 'red', 'green') AS
color | ll_eventStatus is NOT NULL | (ll_eventStatus != '')
using the color value column as color (from the query) and Categorize By ll_sourceIP:
Related reference