Timeline Charts
A chart is a visual representation of your data against time. By using elements such as lines (in a line chart), a chart displays a series of numeric data in a graphical format.
From the Timeline Charts panel, you can perform the following tasks:
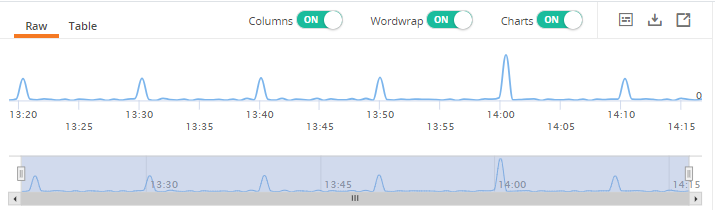
- Showing or hiding the Timeline Charts panel
Click the slider icon
 located in the upper-right corner of the results to show or hide the panel.
- Zooming in or zooming out of timeline charts
You can zoom in or zoom out of a particular area of the timeline chart using the time-range picker.
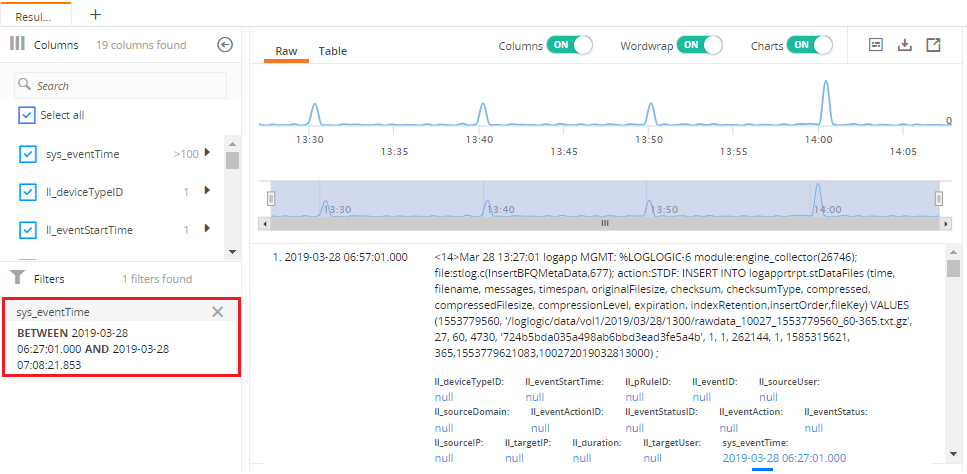
Grab the handles on the X-axis time-range picker, it turns into a slider. Drag the slider across the X-axis to define the time range that you want to zoom in. The timeline chart is updated for the selected time.
The following timeline chart displays the zoomed in data for a specified time range and the Data panel shows the filtered results for the corresponding time range.
You can expand and collapse the time range by dragging the borders of the selected time range to the desired location. Once you define the time range, position the mouse inside the selected time range and drag the slider to define the new time range. Similarly, you can define a specific time by clicking on the timeline chart. The time range can be adjusted at any time.
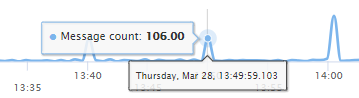
- Viewing timeline chart details
Hover your mouse over any part of the timeline chart to view the time and the number of messages.
- Filtering results based on the time range
You can fine-tune your search results based on the time range. Click the event count (the line that represents the number of events) on the timeline chart or define the time range by zooming in on the timeline chart to view results in the Data panel. A new filter is added for the defined time and the filtered results are displayed on the Data panel.