Geomap Widget
At times, geographical distribution of data is as important as the data itself.
The Geomap widget gives you a unified view of your data visualization and its geographical distribution. For example, you can plot VPN connection logs and the IP addresses from which they originate. The widget displays the IP addresses as points or a bubble chart on the geographical map.
Geomap widget uses the IP address and location information from your data model to plot the data on a map. You can select the geographical map as a particular region or country, or the world map. You can plot IP addresses as points or as a bubble for a region on the map.
Use the following information to configure the widget:
| Field | Description |
|---|---|
| Fetch data from source | |
| Query |
Enter a search query.
You can search based on filter and time Bloks as well. After you enter the search query, the columns from the query are used as field options in the For more information about EQL search syntax, see Event Query Language Reference. |
| Date & Time | You can enter absolute and relative time ranges.
For example, enter -5h as a relative time range to display results for events that occurred in the past 5 hours. For more information and examples, see Time Range Expressions. |
| Source IP | Select the data model column in which IP addresses are stored and that has a data type as INET_ADDR. |
| Location |
Select the column with the location of the area. You must use the geoiplookup(<columnName>, 'location') |
| Location tooltip |
Select the column with the geographical information of the required area. You must use the
For example, if you use the |
| Bubble weight | Select the column that can be used to indicate a number of IP addresses for the selected location. If multiple IP addresses belong to that region on the map, then a bubble is displayed instead of a dot. The size of the bubble is proportionate to the column value. |
| Add series (+) |
Click + to add another row of the Source IP, Location, Location tooltip, and Bubble weight fields. You can add multiple series to the chart. For example, if a data model includes multiple columns that return an INET_ADDR type. |
| Region border color |
Select the color of the region border. Default: #A0A0A0 |
| Map background color |
Select the background color of the region. Default: #E9E9E9 |
| Map |
Select a map type from the available list. Default: World continents |
| Widget description | Enter a short description for the widget. The description is displayed on the Advanced Dashboard when you hover over the widget. |
| Auto load |
Turn on the toggle to automatically load widget data on the Advanced Dashboard as soon as you save the widget or when you navigate to the dashboard. Disabling the Auto load option also disables the Auto refresh option. However, you can manually refresh the widget on the Advanced Dashboard to load its data. Default:
|
| Auto refresh |
Turn on the toggle to refresh the widget every few seconds. This setting is enabled only if the Auto Load option is enabled. Default: OFF |
| Refresh widget every | If Auto refresh is set to ON, then enter a time interval in seconds to refresh the widget. Refresh action starts after the data is completely retrieved and displayed. |
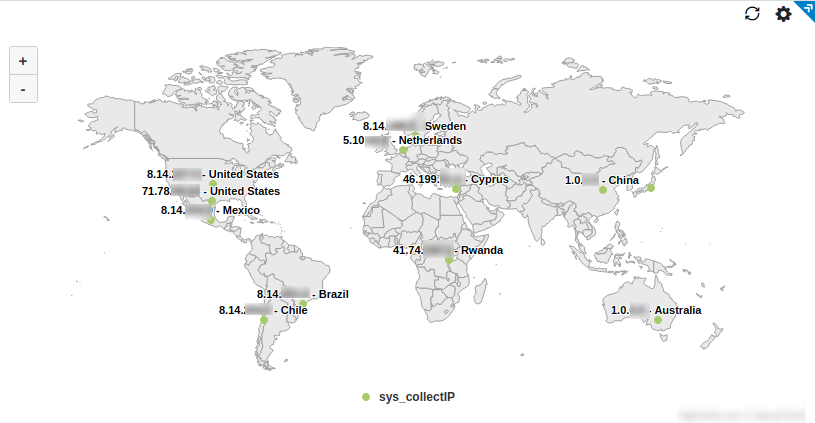
Example Search Query
use system | COLUMNS sys_collectIP, geoiplookup(sys_collectIP,"location"), geoiplookup(sys_collectIP,"country"), count(sys_collectIP) | (sys_collectIP != '127.0.0.1' AND sys_collectIP != '198.51.100.0' AND sys_collectIP != '::1') | group by sys_collectIPIn this example, IP addresses of locations are marked as separate points and country names are displayed as the tooltip. The IP address 198.51.100.0 is an example. Replace it with the IP address of your appliance.