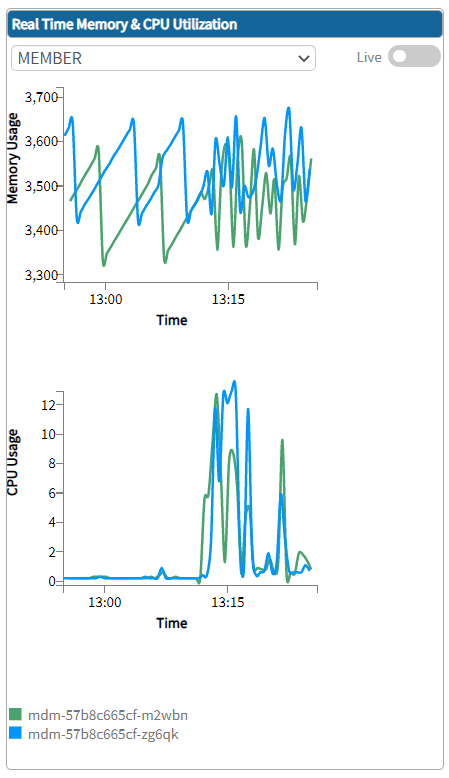
Viewing Application Performance
On the Dashboard page, select the nodename of the server or Cache from the list to view the status of the ibi MDM server node or the cache node.

| Selected Node | Description |
|---|---|
| Memory Usage | Displays how much memory has been used by the ibi MDM server or the cache node out of the total memory. Retrieves the memory from JVM. The memory is displayed in MB. |
| CPU Usage | Shows the CPU usage of the ibi MDM server or cache node in percentage. |
Click the Live option to get live information of the member and cache nodes. You can configure the value in milliseconds by using the Fetch Interval to Show Live Performance of different Components property in the Configurator. For details, see the "Dashboard Configuration Properties" section in ibi MDM System Administration.