View Event Details
The Event Details screen displays details of the selected event in the Events screen.
Using this screen you can:
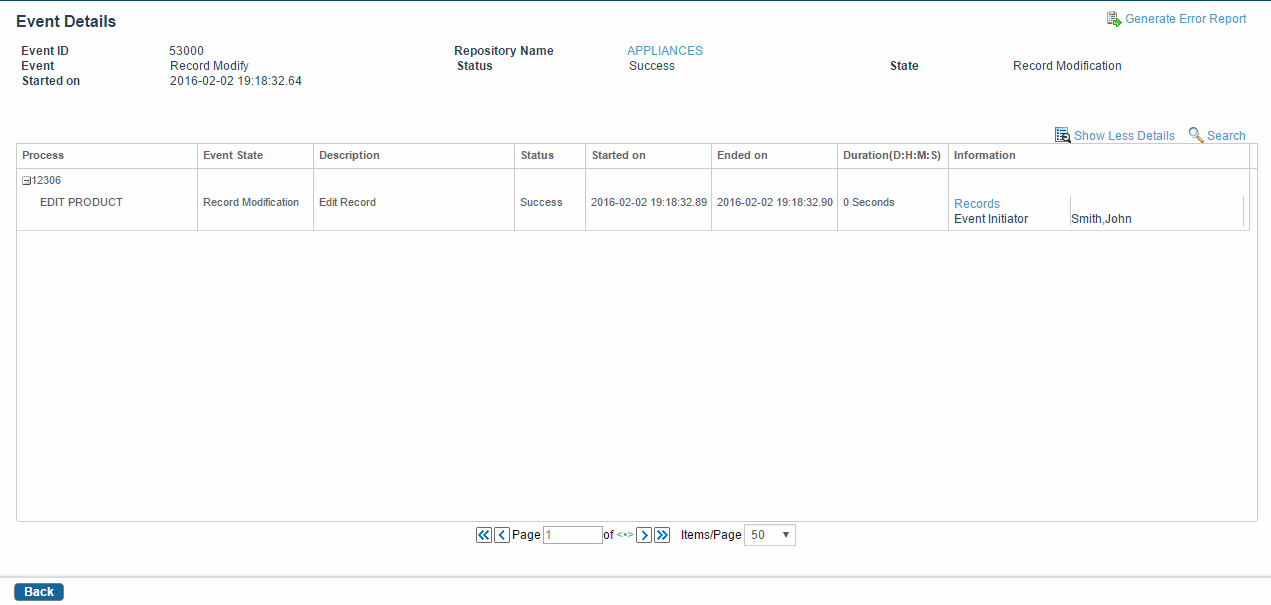
- View Event Summary: The screen displays a summary of the event selected. It shows the event ID, name, state of the event, status of the action, and the date and time of start of the action. If a Backend System is not defined for the event, the header is not displayed.
- View Additional Data: This section allows you to view additional data depending upon the type of an event. Consider the Import Metadata event, you can view the details of how many repositories are imported and how many are failed. You can also view logs by downloading the workflow trace file and an input file. However, if a workflow trace file is not generated, the
Log File option is not displayed.
Note: If the Skip Identify Protocol Operations option is selected while creating a synchronization profile, all product logs are not generated. In this case, for Synchronization event, the details such as, Total Publish and Total Operations are not visible. If the workflow trace is enabled, the detailed trace log or error log file is generated.
- View Additional Attributes: This section allows you to view additional attributes depending upon the type of an event. For example, this section is displayed for Import event, Synchronization event, and so on.
- View Event Details: This section displays a tree table. The Process column represents the tree. The root node of the tree is the process ID that is created for the first workflow selected. The corresponding row of the Information column has the information related to the name and location of the workflow. The leaf node that contains children is represented as a tree node from where you can expand or collapse the tree. The Information column shows only two rows of data. If more rows of data are present, a toggle link that can either be Show More or Show Less is displayed. You can use these links to expand or collapse the information. The spawned events are represented as a link. To view the details of the event, click the link.
- By default, product logs are not shown on the Event Detail screen. The Records link is displayed. When you click this link, the records are displayed on a separate screen. If you want the product logs to be displayed on the Event Detail screen, configure the application using the Configurator (Optimization > Event Log Product Detail Visibility). For more information on using the Configurator, refer to the TIBCO MDM Installation and Configuration Guide.
- Activities are arranged is in an ascending order. The activities are ordered by the sequence they have been executed.
- View Error Details: You can view the details of an error by clicking the error link in the Status column. This lets you open or save the error details as an XML file.
- Error Report: If you find errors in the event, you can generate a report of these errors. Click the Generate Error Report link in the upper-right corner of the Event Details page to generate a report of errors. A report is generated and the Download link is displayed in the Additional Data section. Click the Download link to download the report. The File Download dialog is displayed. You can either choose to save or open the ZIP file. It comprises a list of XML files. To view the errors, open the .log or .csv files.
Copyright © Cloud Software Group, Inc. All rights reserved.