You can view the dashboard by clicking
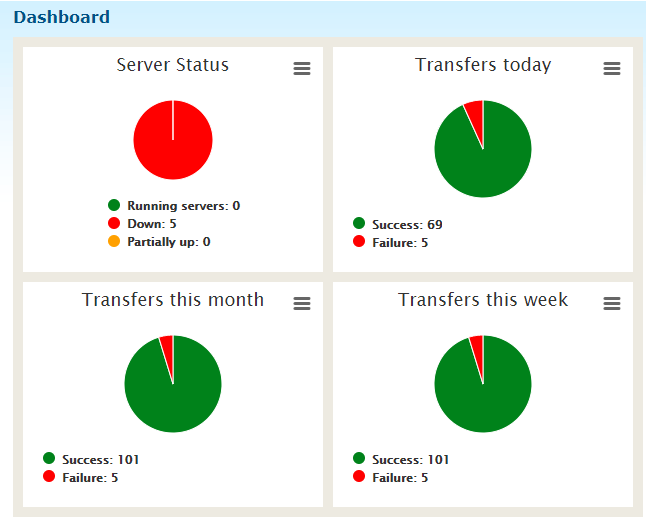
Reports > Dashboard. The Dashboard page displays four charts.
The following table provides a description of the charts:
Chart
Description
Server Status
Displays the status of target MFT Servers. The chart is displayed in three colors:
Green: Indicates that the server is up and available. For a Platform Server, it also means that the Server is at a level compatible with Command Center functions and has been configured to accept Command Center requests.
Yellow: Is displayed only for Platform Servers. Yellow means that the server is available, but the Server is not at a level compatible with Command Center requests, or is not configured to accept Command Center requests.
Red: Indicates that the server is down. Internet Server cannot connect to the IPName:Port defined in the server definition. If you click on one of the three colors, a box is displayed that shows the servers with the selected status.
Transfers this week
Displays the status of completed transfers for today and the prior 6 days. Successful transfers are displayed in Green and failed transfers are displayed in Red.
Transfers this month
Displays the status of completed transfers for today and the prior 29 days. Successful transfers are displayed in Green and failed transfers are displayed in Red.
Transfers today
Displays the status of completed transfers for today. Successful transfers are displayed in Green and failed transfers are displayed in Red.
Server Status and
Transfers today are live data and refresh every 60 seconds by default
By clicking on the 3 lines at the top right of the dashboard, you can do the following:
Print the Dashboard chart.
Download the chart to a PNG, JPEG, PDF, or SVG file.
Configure the refresh interval. This is only available for the
Server Status and
Transfers today charts.