Transfer Dashboard
The Transfers Dashboard page allows you to define a variety of ways that transfer statistics can be displayed.
You can specify the
From Date and the
To Date to define the transfers that are included in the dashboard. You can also
Select a view from the following options to display the transfer statistics:
| View | Description |
|---|---|
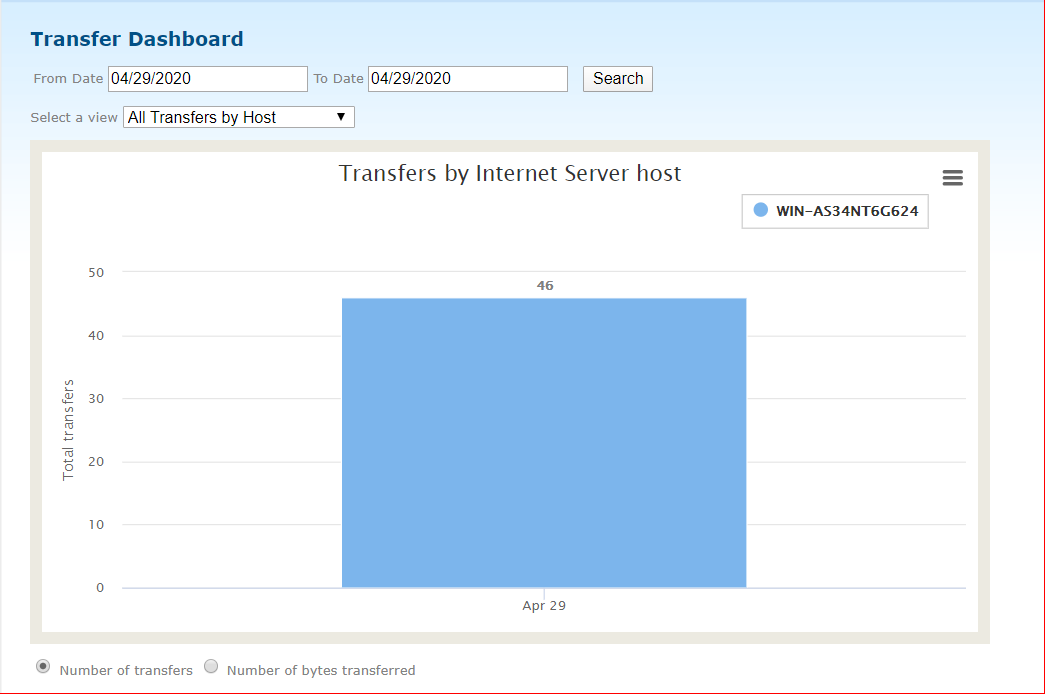
| All Transfers by Host | Displays all transfers by Internet Server Host instance. A list of hosts is displayed at the top of this chart. You can select or de-select hosts by clicking on the radio button to the left of the host name. A radio button at the bottom of the chart allows you to view the charts based on the "Number of Transfers" or the "Number of bytes transferred". If you click on a bar in the chart, the selection criteria will change to the date of the bar selected; clicking on the bar again returns to the original dates. |
| All Transfers by Protocol | Displays all transfers by Internet Server client protocol. A list of client protocols is displayed at the top of this chart. You can select or de-select client protocols by clicking on the radio button to the left of the client protocol. A radio button at the bottom of the chart allows you to view the charts based on the "Number of Transfers" or the "Number of bytes transferred". If you click on a bar in the chart, the selection criteria will change to the date of the bar selected; clicking on the bar again returns to the original dates. |
| Failed Transfers by Host | Displays failed transfers by Internet Server host instance. A list of hosts is displayed at the top of this chart. You can select or de-select hosts by clicking on the radio button to the left of the host name. A radio button at the bottom of the chart allows you to view the charts based on the "Number of transfers with errors" or the "Percentage of transfers with errors". If you click on a bar in the chart, the selection criteria will change to the date of the bar selected; clicking on the bar again returns to the original dates. |
| Failed Transfers by Protocol | Displays failed transfers by Internet Server client protocol. A list of protocols is displayed at the top of this chart. You can select or de-select client protocols by clicking on the radio button to the left of the client protocol. A radio button at the bottom of the chart allows you to view the charts based on the "Number of transfers with errors" or the "Percentage of transfers with errors". If you click on a bar in the chart, the selection criteria will change to the date of the bar selected; clicking on the bar again returns to the original dates. |
| Transfers by Target Server | Displays transfers by Target Server. Three pie charts are displayed with "slices" for each target Server.: : Number of Transfers : Bytes Transferred : Number of errors You can define the number of servers to display by updating the "Show xx entries". You can use the Search box to filter servers to display. Below the pie charts is a list of target servers. You can use the check boxes to select the servers to be displayed. You can click on the column headers to sort the data. |
Copyright © 2022. Cloud Software Group, Inc. All Rights Reserved.