Data Flow of Monitoring Data and Log Messages
The following diagram illustrates the flow of Apache Kafka monitoring data and log messages.
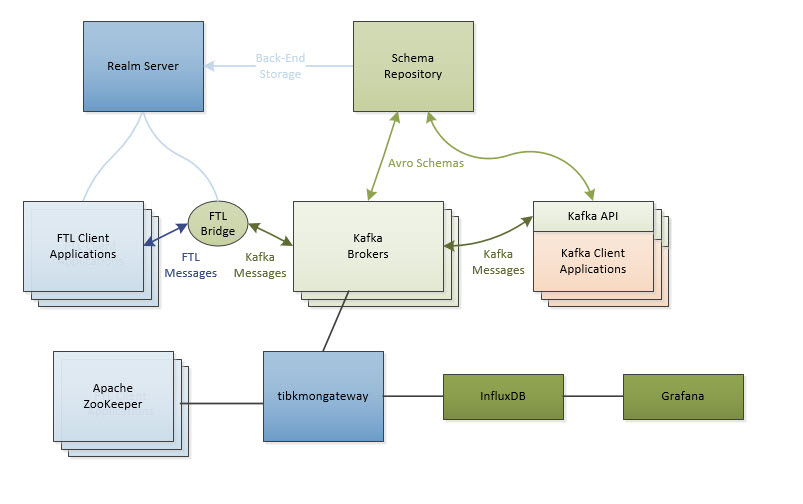
Explanation of the Diagram
- All monitoring data begins in either the Kafka Brokers or Apache ZooKeeper nodes. The tibkmongateway process collects the full set of available statistics from the Apache Kafka Brokers as well as the Apache Kafka-related statistics from the Apache ZooKeeper nodes. It posts the collected statistics to an InfluxDB database.
-
InfluxDB is an open-source database. You can access the data directly from InfluxDB, or using other tools that manipulate and display the data, for example, Grafana.
Copyright © Cloud Software Group, Inc. All rights reserved.