Grafana and Dashboard Examples
Grafana is an open source application to visualize large-scale measurement data. You can use Grafana to display monitoring data stored in a database.
Grafana can display monitoring statistics using configurable dashboards in a web browser.
The installer adds the Apache Kafka monitoring dashboards as part of the installation procedure so they are available for viewing using Grafana. The dashboards include a top-level dashboard which displays statistics common to many messaging systems as well as a detailed set of Apache Kafka and Apache ZooKeeper dashboards.
The messaging independent top level dashboard displays information from both Apache Kafka and TIBCO FTL allowing high-level messaging statistics from both messaging systems to be monitored from a single dashboard.
The provided Grafana dashboards are tailored to display monitoring data grouped by similar Apache Kafka functionality.
When the monitoring start script starts the Grafana server, it automatically loads the Apache Kafka dashboards from /opt/tibco/akd/bridge/2.3/monitoring/tibkmon/grafana-dashboards.
You can also modify the existing dashboards or define your own dashboards. For more information, refer to the Grafana documentation.
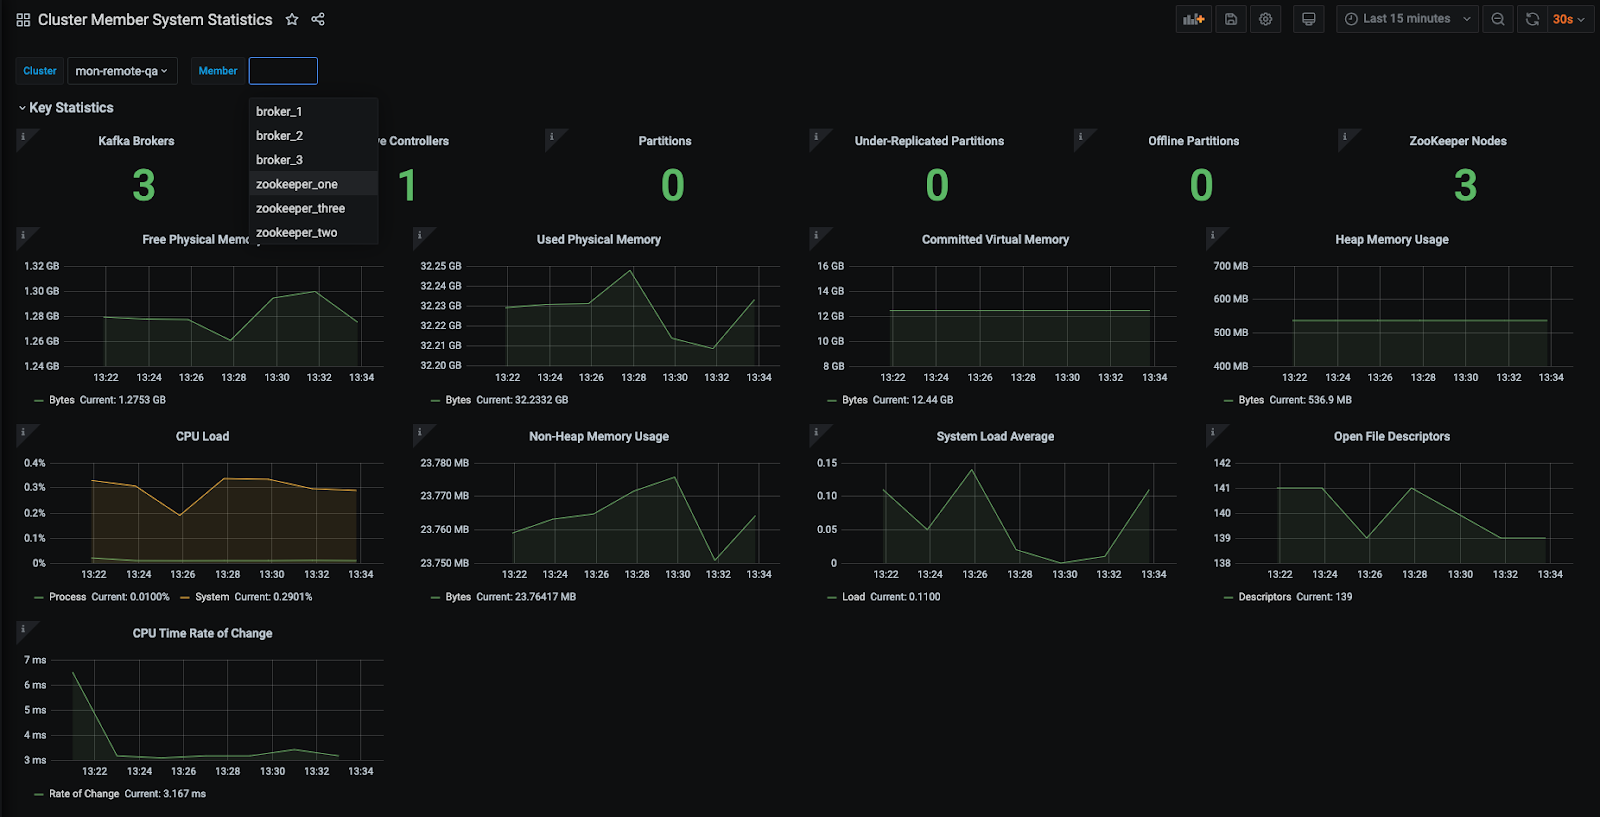
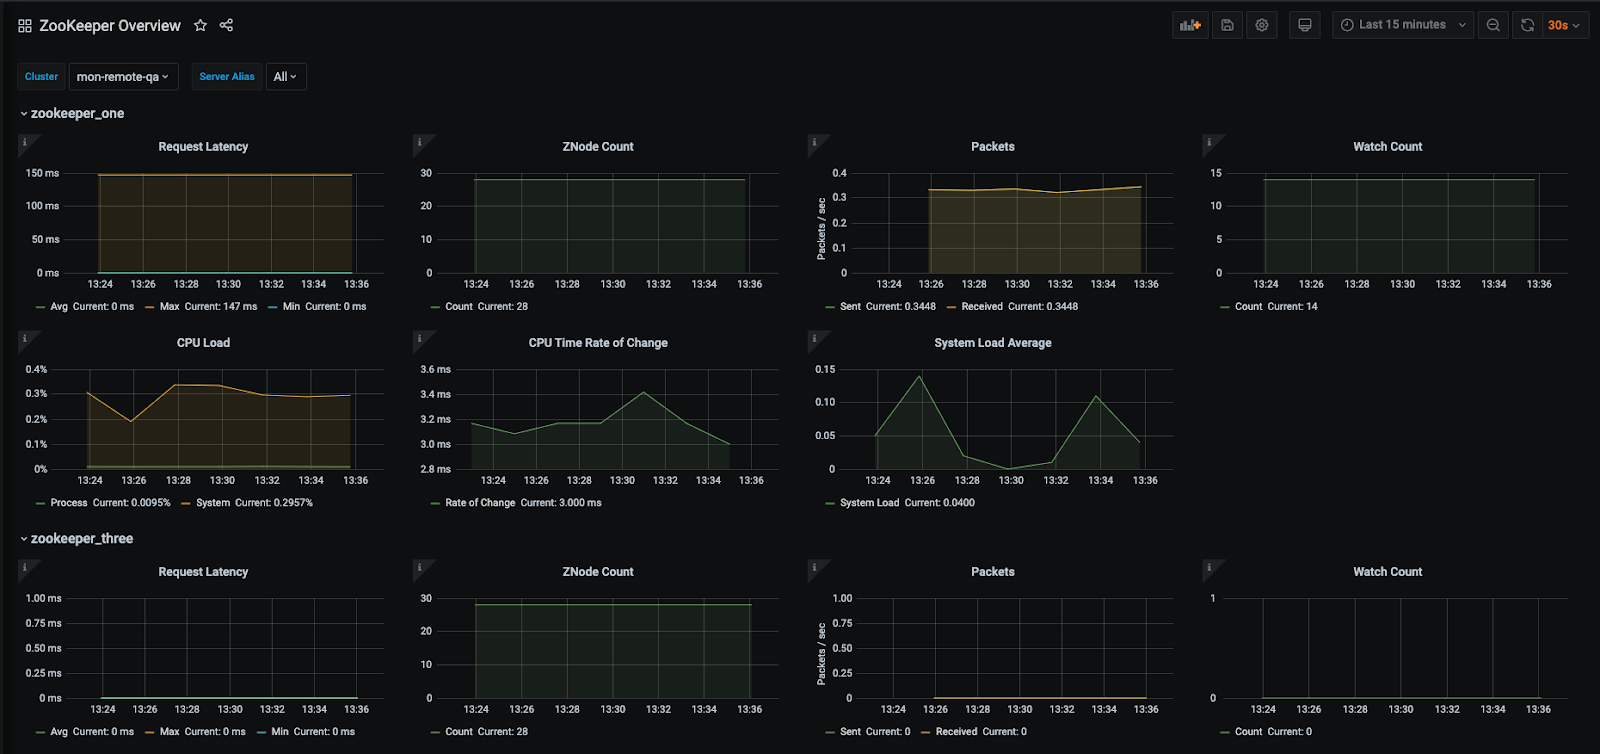
Here are some typical dashboard images using the supplied dashboards.