Example 1 Defining Traffic Lights Display Metric Links
In this example the upper threshold (yellow to green) is 95% and the lower threshold (yellow to red) is 92%.
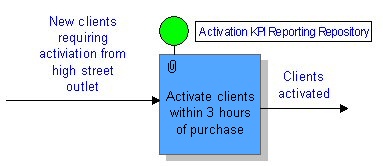
The above figure shows that the performance of the new client acquisition process is good. However, in the figure below, the KPI has fallen below 92% of new clients being activated within 3 hours, therefore indicating a problem.
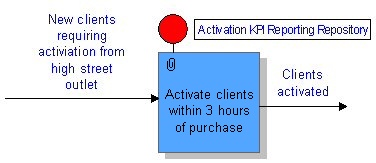
If a problem is being indicated, as demonstrated by a red traffic light, a user could drill down to review the process in greater detail and work out why it is under-performing before deciding how to move forward with addressing the issue.
For information on creating traffic light metric links see Traffic Lights Metric Link Display Type.