Hawk RedTail Data Source
TIBCO OI Hawk RedTail provides pre-configured data source named Hawk RedTail. This is the default data source. This is the default plug-in which acts as a translator between Grafana and TIBCO OI Hawk RedTail. The plug-in fetches query results from TIBCO OI Hawk RedTail and then transforms those results into Grafana compatible information. Then, Grafana displays this translated information in the form of visualization specified by the user. Following is an example of visualizing Hawk metrics by using the Hawk RedTail data source.
Visualizing Metrics by using Hawk RedTail Data Source
You can visualize metrics by using Hawk RedTail data source. For example, to visualize time series metrics TS_node_memory_MemFree_bytes which show free memory in bytes by using graph visualization, perform the following steps.
Before you beginEnsure that you have configured the Hawk RedTail data source. For more information about Configuring Hawk RedTail data source, see TIBCO® Operational Intelligence Hawk® RedTail Installation, Configuration, and Administration.
|
1.
|
Navigate to the Dashboard page where you want to add the metrics visualization. |
|
2.
|
Click the Create icon ( ) and then select Dashboard to open the New Dashboard page. ) and then select Dashboard to open the New Dashboard page. |
|
3.
|
Click the Add Panel button to create a new panel. |
|
4.
|
Specify the panel title and panel description from the Settings section in the Panel tab on the right side of the New Dashboard/ Edit Panel page. |
|
5.
|
In the Query tab below the visualization, select the Hawk RedTail data source if it is not selected by default. |
|
6.
|
From the Metrics drop-down list, select TS as data model and then select TS_node_memory_MemFree_bytes as the metrics to be visualized. |
|
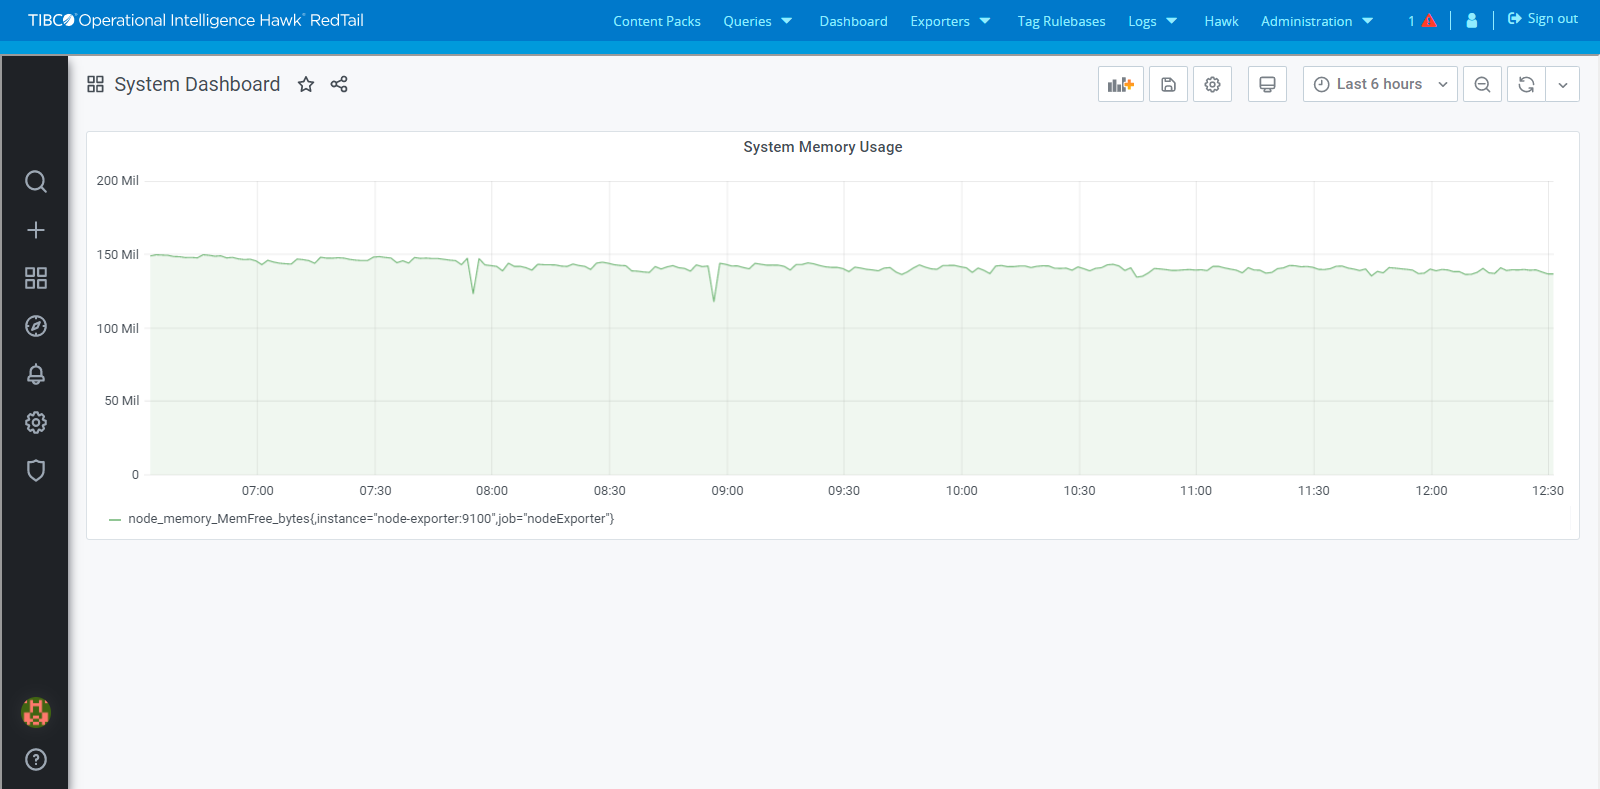
7.
|
Select the Graph as the visualization style from Visualization section in the Panel tab on the right side of the New Dashboard/ Edit Panel page. Following is the result of visualizing metrics in a graphical format: |