System Architecture and Components for Containerized and Hybrid Deployments
TIBCO OI Hawk RedTail is an application which provides distinct features and capabilities. TIBCO OI Hawk RedTail core components are typically deployed in a private cloud environment such as Kubernetes. The deployment of TIBCO OI Hawk RedTail core components is a one-time process. Once the components are successfully deployed, you can install and configure Hawk agents on different platforms , on-premises platforms and cloud clusters (such as Kubernetes and Docker). The Hawk agents can be configured to connect to a single Hawk RedTail Console. For more information, see the following sections:
| • | Hawk Agent Deployed in a Different Kubernetes or Docker Cluster |
| • | Hawk Agent Deployed in an On-Premises environment |
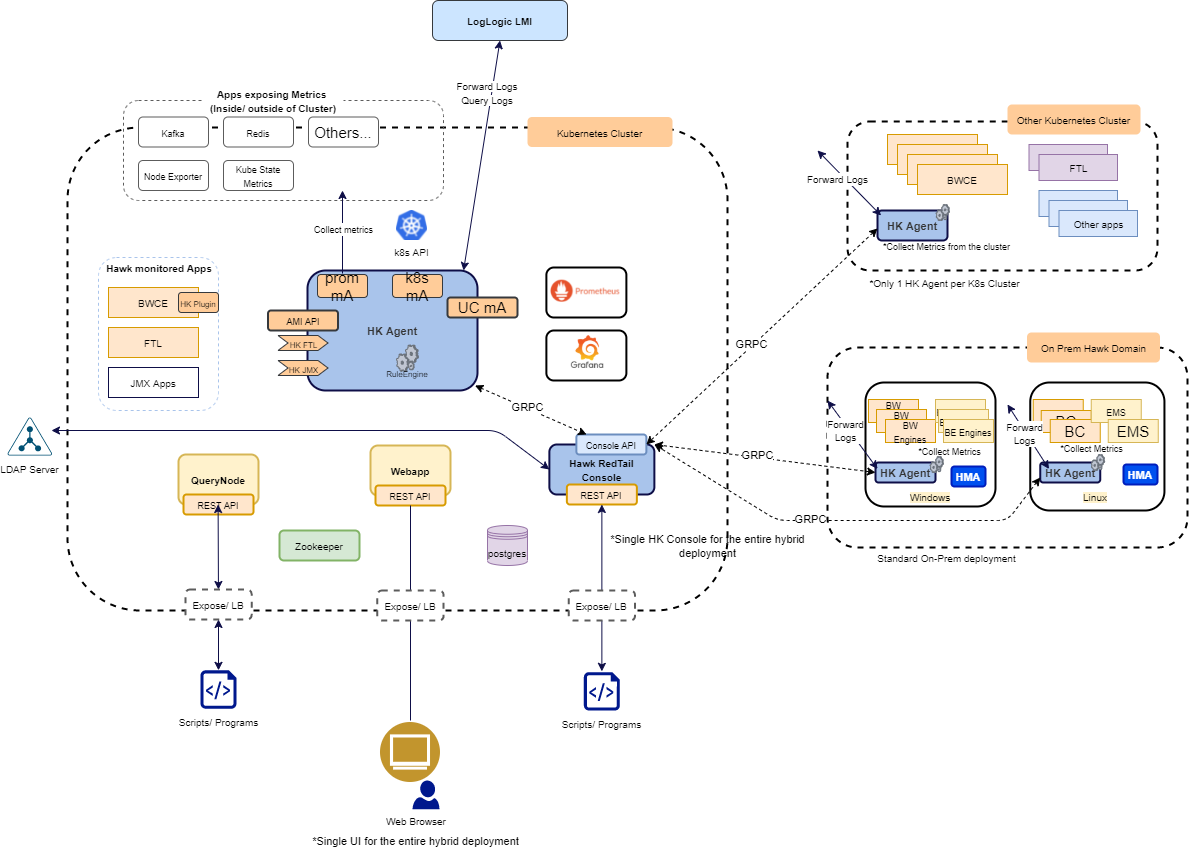
The following figure shows the components of TIBCO OI Hawk RedTail for monitoring TIBCO and third-party applications and services.
TIBCO OI Hawk RedTail Hybrid Architecture
Hawk Agent Deployed in a Different Kubernetes or Docker Cluster
You can enable TIBCO OI Hawk RedTail to monitor a Kubernetes or Docker cluster other than the one where the core components are deployed. To do so, you must deploy the Hawk agent in a different Kubernetes or a Docker cluster. Before you deploy the Hawk agent in the cluster, ensure that you have performed the following steps:
| • | Created a domain in TIBCO OI Hawk RedTail. |
| • | Configured the gRPC Transport environment variables, and the hawk_domain environment variable. |
The Hawk agent then makes the use of Hawk microagents to monitor the applications within the cluster and also the cluster itself. The Hawk agent also enables the Hawk RedTail Console to collect the metrics from various metric sources with the help of Hawk microagents or Prometheus exporters.
Hawk Agent Deployed in an On-Premises environment
You can enable TIBCO OI Hawk RedTail to monitor an on-premises environment such as Linux or Windows. To do so, you must select the TIBCO OI Hawk RedTail 7.2.0 Agent installation profile while installing TIBCO OI Hawk RedTail. Once the installation process is complete, ensure that you have performed the following steps:
| • | Created a domain in TIBCO OI Hawk RedTail. |
| • | Configured the gRPC Transport and the hawk_domain parameters in the hawkagent.cfg file, and the hawk_domain parameter in the hawkhma.cfg file. |
Performing these steps enables the Hawk agent in the on-premises environment to communicate with the Hawk RedTail Console. The Hawk agent then uses Hawk microagents to monitor the on-premises environment and also enables the Hawk RedTail Console to collect metrics with the help of Hawk microagents or Prometheus exporters.
To enable the microagents for the Hawk agent to monitor the on-premise platform such as Windows or Linux, specify the rvd_session parameter in the hawkagent.cfg and hawkhma.cfg files.
TIBCO OI Hawk RedTail Core Components
These components run as separate microservices and can be configured as required. You can configure these components using the environment variables in manifest files or Kubernetes Helm charts. For more information, see Environment Variables for TIBCO OI Hawk RedTail Components.
| • | Hawk Agent |
| • | Hawk Microagent |
| • | Hawk RedTail Console |
| • | Grafana |
| • | Time Series Storage (Prometheus) |
| • | Prometheus Service Discovery Sidecar Container |
| • | Apache ZooKeeper |
| • | Query Node |
| • | Webapp |
Hawk Agent
The Hawk Agent is a process that monitors activity on a particular application by using microagents.
In TIBCO OI Hawk RedTail, the Hawk Agent has built-in microagents to monitor the Kubernetes cluster or Docker infrastructure. The Hawk Agent uses rulebases to automate the monitoring using rules, alerts and actions. The Hawk Agent container connects to the Hawk RedTail Console container to form a cluster by using the gRPC transport for Hawk.
Hawk Microagent
TIBCO OI Hawk RedTail has built-in microagents for monitoring Kubernetes infrastructure, or Docker host (if the deployment is on Docker) and you can also configure other microagents to monitor TIBCO and third party applications and services for example, TIBCO BusinessWorks™ Container Edition, TIBCO FTL, TIBCO ActiveMatrix, etc. For more information, refer to TIBCO® Operational Intelligence Hawk® RedTail Microagent Reference. Hawk microagents connect to the Hawk agent using the gRPC Transport for Hawk.
Hawk RedTail Console
You can use the REST API to access the TIBCO OI Hawk RedTail features like Hawk microagent methods, alerts, tag based rulebases, content packs, and query. The Hawk RedTail Console and the Query Node expose the other TIBCO OI Hawk RedTail components and external clients/scripts. The Hawk RedTail Console exposes administration and functional APIs. You can access the Hawk RedTail Console REST API by navigating to the Swagger page https://<redtail_console_IP>:<rtc_port>/hawkconsole/v1/docs.
Grafana
The Grafana component enables you to create customized dashboards. You can create and maintain multiple dashboards at once and also customize the panels within the dashboards in which multiple queries can be configured.
With the Grafana RedTail Datasource Plug-in, each dashboard panel can be visualized as graphical representations such as line charts, tables, and gauges. This is possible by using the Grafana RedTail Datasource Plug-in. This is the default plug-in that acts as a translator between Grafana and TIBCO OI Hawk RedTail. The plug-in fetches the query results from TIBCO OI Hawk RedTail then converts those results into Grafana compatible information. Grafana then displays this translated information in the form of visualization specified by the user. For more information about Grafana, see https://grafana.com/docs/.
Time Series Storage (Prometheus)
A time-series database is used to store and retrieve data records that are part of a “time series,” which is a set of data points that are associated with timestamps. The data is collected from a data source over a period of time. A time-series database lets you store large volumes of time stamped data in a format that allows fast insertion and fast retrieval to support complex analysis on that data. The collection of data is done by using metrics exporter. An exporter converts standard metrics into time series compatible metrics. The Hawk RedTail Console acts as a Prometheus Exporter, that is, the Prometheus server scrapes metrics from Hawk RedTail Console at a regular interval. The Hawk RedTail Console then generates metrics by subscribing to microagent methods of different Hawk Agents. For more information about Prometheus, see https://prometheus.io/docs/.
Prometheus Service Discovery Sidecar Container
The Prometheus Service Discovery Sidecar container is a helper container to the Prometheus server. This component assists Prometheus to discover metrics path from Hawk RedTail Console by using file-based discovery. The sidecar component discovers new targets exposed by the Hawk RedTail Console and then updates these targets in the /etc/hawkprometheus-discovery/hawktargets.json file. The sidecar container keeps updating the hawktargets.json file. The Prometheus server uses this file to discover new targets or update the existing targets and then scrapes metrics from the targets.
In the prometheus.yml file, the job_name parameter (which has the job name as prometheusmetrics) uses the file-based service discovery by listening on the /etc/hawkprometheus-discovery/hawktargets.json file. The sidecar container continually updates the hawktargets.json file. The prometheus.yml file contains the following jobs:
| • | hawkmetrics: To pull Hawk exporter metrics |
| • | prometheusmetrics: To pull Prometheus exporter metrics |
This is the prometheus.yml file showing examples of Hawk metrics and Prometheus metrics jobs:
# Load rules once and periodically evaluate them according to
# the global 'evaluation_interval'.
rule_files:
# - "first_rules.yml"
# - "second_rules.yml"

# A scrape configuration containing exactly
# one endpoint to scrape:
# Here it's Prometheus itself.
scrape_configs:
# The job name is added as a label `job=<job_name>`
# to any timeseries scraped from this config.
- job_name: 'hawkmetrics'
  metrics_path: '/hawkconsole/exporter/hawk/metrics'
  scheme: https
  honor_labels: true
  tls_config:
    insecure_skip_verify: true
    ca_file: '/etc/prometheus/hkc-cacert'
    cert_file: '/etc/prometheus/prom-certificate'
    key_file: '/etc/prometheus/prom-key'
  static_configs:
    - targets: ['hawkconsolenode:9687']
- job_name: 'prometheusmetrics'
  scheme: https
  honor_labels: true
  tls_config:
    insecure_skip_verify: true
    ca_file: '/etc/prometheus/hkc-cacert'
    cert_file: '/etc/prometheus/prom-certificate'
    key_file: '/etc/prometheus/prom-key'
  file_sd_configs:
    - files:
        - /etc/hawkprometheus-discovery/hawktargets.json
Apache ZooKeeper
Apache ZooKeeper is a centralized service for maintaining configuration information, applying naming conventions, and providing group services. These services are used in distributed applications.
Query Node
Query node helps in the creation of a search query for collecting the data about the metrics by using the Operational Intelligence Search Query Language. The search query supports Event Query Language (EQL) and a subset of Structured Query Language (SQL). You can run queries using Data Models, which are normalized data sets automatically created for every collected metric/Hawk microagent data. You can also use filters, limited regular expressions and time range filters in the queries. The Query Node exposes APIs to execute a query and other query related operations. You can access the Query Node REST API by navigating to the Swagger page https://<querynode>:<querynode_port>/docs. For more information about querying, see TIBCO® Operational Intelligence Hawk® RedTail User's Guide.
Webapp
Webapp provides a GUI for a centralized view across the distributed components within the TIBCO OI Hawk RedTail environment.
With integrated data from components such as Grafana and Prometheus, the Webapp component provides a user-friendly interface for users to interact and monitor the data of the system.
Additionally, the user is able to configure new artifacts such as metrics, use search tools to query the data, or define the access privileges for different users.