System Architecture and Components for Enterprise Deployment
This section describes the architecture for the following types of deployment of TIBCO OI Hawk RedTail:
| • | Architecture for TIBCO OI Hawk RedTail Standalone Enterprise Deployment |
| • | Architecture for TIBCO OI Hawk RedTail High Availability Enterprise Deployment |
Architecture for TIBCO OI Hawk RedTail Standalone Enterprise Deployment
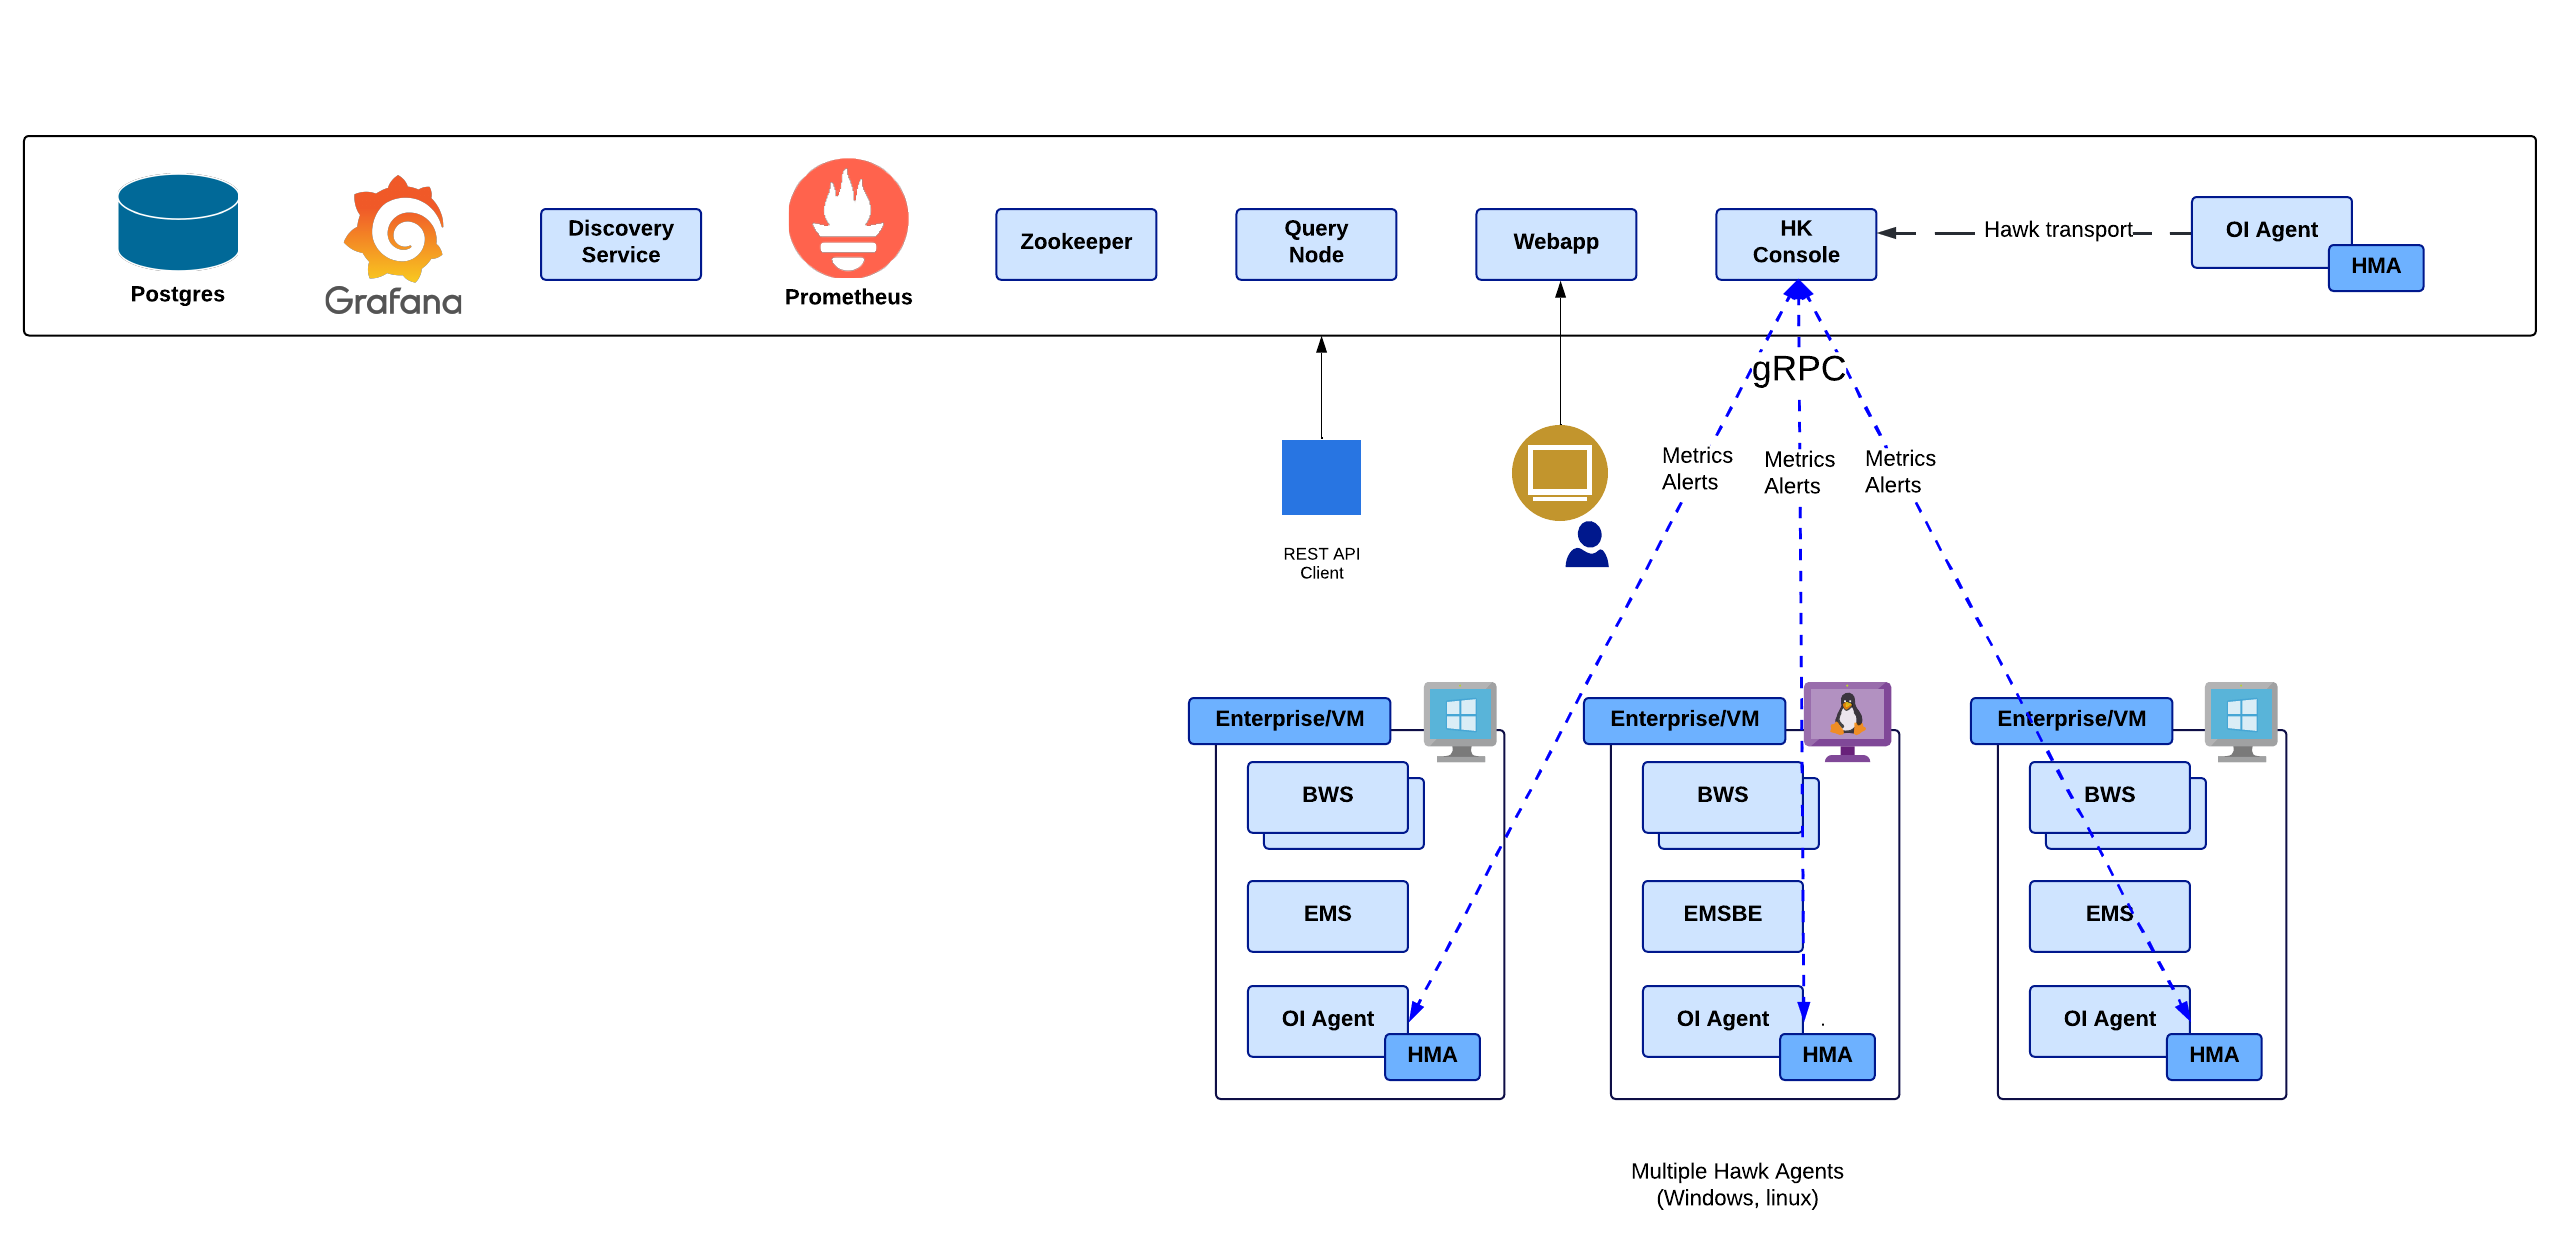
In this type of deployment, all the components of TIBCO OI Hawk RedTail are deployed on a single physical or virtual machine. There is only a single instance running of each component, hence no fallback or recovery mechanism occurs if a component stops functioning. Therefore, you must manually restart the component.
Architecture for TIBCO OI Hawk RedTail High Availability Enterprise Deployment
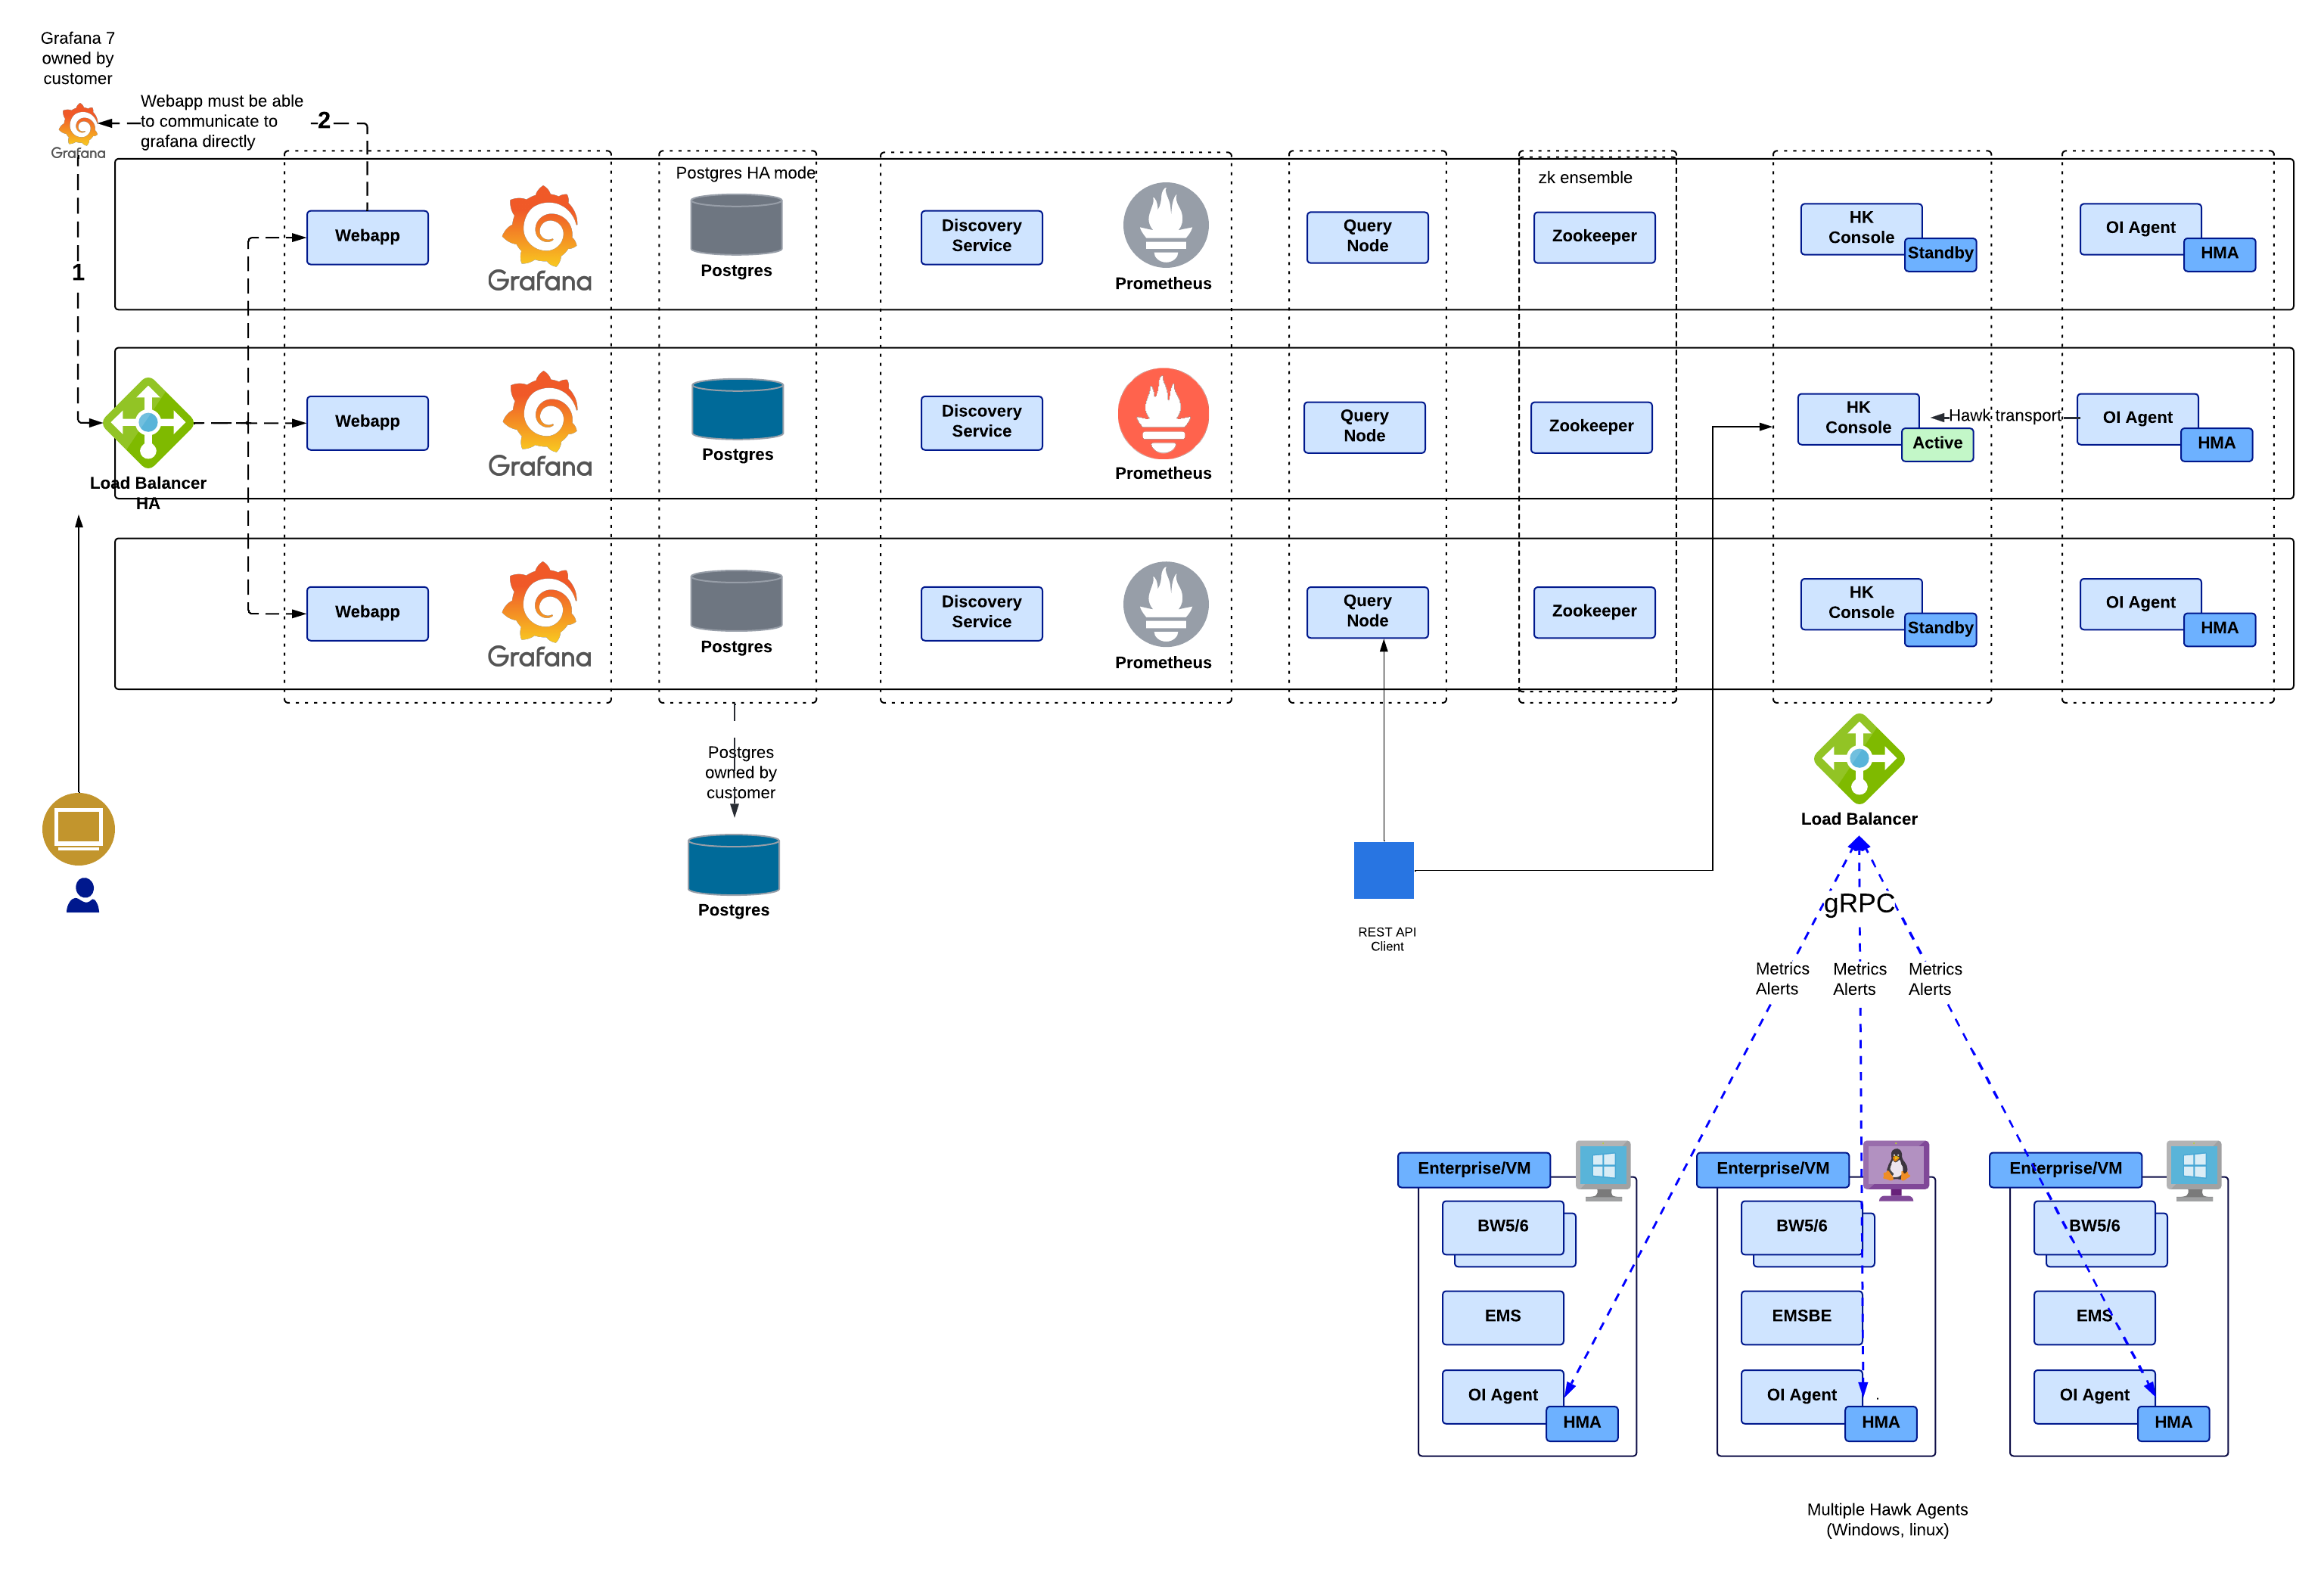
In this type of deployment, you must install all the components of TIBCO OI Hawk RedTail on three separate machines and then configure those components to communicate with each other through ZooKeeper to achieve high availability.
To enable HA, perform the following steps:
| • | Install TIBCO OI Hawk RedTail on three separate physical or virtual machines. |
| • | Configure ZooKeeper ensemble and other services to communicate with each other. |
| • | Configure the zookeeper.connectString parameter in every component's configuration file. |
Make note of the following conditions in case of high availability deployment:
| • | Only one instance of Hawk RedTail Console is in active state and the other two instances are in standby state. |
| • | Only one instance of Prometheus server is in use and PostgreSQL is setup to run in HA mode. The components deployed on the other machines must be configured to use this server. |
| • | The query is handled for its entire lifecycle by the same instance of the querynode on which it was created. |
TIBCO OI Hawk RedTail Components
| • | Hawk Agent |
| • | Hawk Microagent |
| • | Hawk RedTail Console |
| • | Grafana |
| • | Time Series Storage (Prometheus) |
| • | Prometheus Service Discovery Service |
| • | Apache ZooKeeper |
| • | Query Node |
| • | Webapp |
These components run as separate services and can be configured as required. You can configure these components using the configuration files. For more information, see Configuration of TIBCO OI Hawk RedTail Enterprise Components.
Hawk Agent
The Hawk Agent is a process that monitors activity on a particular application by using microagents.
In TIBCO OI Hawk RedTail, the Hawk Agent has built-in microagents to monitor the enterprise infrastructure. The Hawk Agent uses rulebases to automate the monitoring using rules, alerts and actions. The Hawk Agent connects to the Hawk RedTail Console by using the gRPC transport for Hawk.
Hawk Microagent
TIBCO OI Hawk RedTail has built-in microagents for monitoring enterprise infrastructure and you can also configure other microagents to monitor TIBCO and third party applications and services for example, TIBCO BusinessWorks™ Container Edition, TIBCO FTL, TIBCO ActiveMatrix, etc. For more information, refer to TIBCO® Operational Intelligence Hawk® RedTail Microagent Reference. Hawk microagents connect to the Hawk agent using the gRPC Transport for Hawk.
Hawk RedTail Console
You can use the REST API to access the TIBCO OI Hawk RedTail features like Hawk microagent methods, alerts, tag based rulebases, content packs, and query. The Hawk RedTail Console and the Query Node expose the other TIBCO OI Hawk RedTail components and external clients/scripts. The Hawk RedTail Console exposes administration and functional APIs. You can access the Hawk RedTail Console REST API by navigating to the Swagger page https://<redtail_console_IP>:<rtc_port>/hawkconsole/v1/docs.
Grafana
The Grafana component enables you to create customized dashboards. You can create and maintain multiple dashboards at once and also customize the panels within the dashboards in which multiple queries can be configured.
With the Grafana RedTail Datasource Plug-in, each dashboard panel can be visualized as graphical representations such as line charts, tables, and gauges. This is possible by using the Grafana RedTail Datasource Plug-in. This is the default plug-in that acts as a translator between Grafana and TIBCO OI Hawk RedTail. The plug-in fetches the query results from TIBCO OI Hawk RedTail then converts those results into Grafana compatible information. Grafana then displays this translated information in the form of visualization specified by the user. For more information about Grafana, see https://grafana.com/docs/.
Time Series Storage (Prometheus)
A time-series database is used to store and retrieve data records that are part of a “time series,” which is a set of data points that are associated with timestamps. The data is collected from a data source over a period of time. A time-series database lets you store large volumes of time stamped data in a format that allows fast insertion and fast retrieval to support complex analysis on that data. The collection of data is done by using metrics exporter. An exporter converts standard metrics into time series compatible metrics. The Hawk RedTail Console acts as a Prometheus Exporter, that is, the Prometheus server scrapes metrics from Hawk RedTail Console at a regular interval. The Hawk RedTail Console then generates metrics by subscribing to microagent methods of different Hawk Agents. For more information about Prometheus, see https://prometheus.io/docs/.
Prometheus Service Discovery Service
The Prometheus Service Discovery service is a helper to the Prometheus server. This component assists Prometheus to discover metrics path from Hawk RedTail Console by using file-based discovery. The service discovers new targets exposed by the Hawk RedTail Console and then updates these targets in the /usr/local/tibco_redtail_data/prometheus_discoveryservice/hawktargets.json file. The service keeps updating the hawktargets.json file. The Prometheus server uses this file to discover new targets or update the existing targets and then scrapes metrics from the targets.
In the prometheus.yml file, the job_name parameter (which has the job name as prometheusmetrics) uses the file-based service discovery by listening on the /etc/hawkprometheus-discovery/hawktargets.json file. The service continually updates the hawktargets.json file. The prometheus.yml file contains the following jobs:
| • | hawkmetrics: To pull Hawk exporter metrics |
| • | prometheusmetrics: To pull Prometheus exporter metrics |
This is the prometheus.yml file showing examples of Hawk metrics and Prometheus metrics jobs:
# Global config
global:
 scrape_interval: 15s # Set the scrape interval to every 15 seconds. Default is every 1 minute.
 evaluation_interval: 15s # Evaluate rules every 15 seconds. The default is every 1 minute.
 # scrape_timeout is set to the global default (10s).

# Alertmanager configuration
alerting:
 alertmanagers:
 - static_configs:
  - targets:
   # - alertmanager:9093

# Load rules once and periodically evaluate them according to the global 'evaluation_interval'.
rule_files:
# - "first_rules.yml"
# - "second_rules.yml"

# A scrape configuration containing exactly one endpoint to scrape:
# Here it's Prometheus itself.
scrape_configs:
# The job name is added as a label
`job=<job_name>` to any timeseries scraped from this config.
- job_name: 'redtailmetrics'
 scheme: https
 honor_labels: true
 tls_config:
  insecure_skip_verify: true
  ca_file:   '/usr/local/etc/rt_certs/cacert'
  cert_file: '/usr/local/etc/rt_certs/prometheus-client-certificate'
  key_file:  '/usr/local/etc/rt_certs/prometheus-client-key'
 file_sd_configs:
  - files:
    # Output file from Prometheus-discoveryservice service
    - /usr/local/tibco_redtail_data/prometheus_discoveryservice/hawktargets.json
Apache ZooKeeper
Apache ZooKeeper is a centralized service for maintaining configuration information, applying naming conventions, and providing group services. These services are used in distributed applications.
Query Node
Query node helps in the creation of a search query for collecting the data about the metrics by using the Operational Intelligence Search Query Language. The search query supports Event Query Language (EQL) and a subset of Structured Query Language (SQL). You can run queries using Data Models, which are normalized data sets automatically created for every collected metric/Hawk microagent data. You can also use filters, limited regular expressions and time range filters in the queries. The Query Node exposes APIs to execute a query and other query related operations. You can access the Query Node REST API by navigating to the Swagger page https://<querynode>:<querynode_port>/docs. For more information about querying, see TIBCO® Operational Intelligence Hawk® RedTail User Guide.
Webapp
Webapp provides a GUI for a centralized view across the distributed components within the TIBCO OI Hawk RedTail environment.
With integrated data from components such as Grafana and Prometheus, the Webapp component provides a user-friendly interface for users to interact and monitor the data of the system.
Additionally, the user is able to configure new artifacts such as metrics, use search tools to query the data, or define the access privileges for different users.