Dashboard
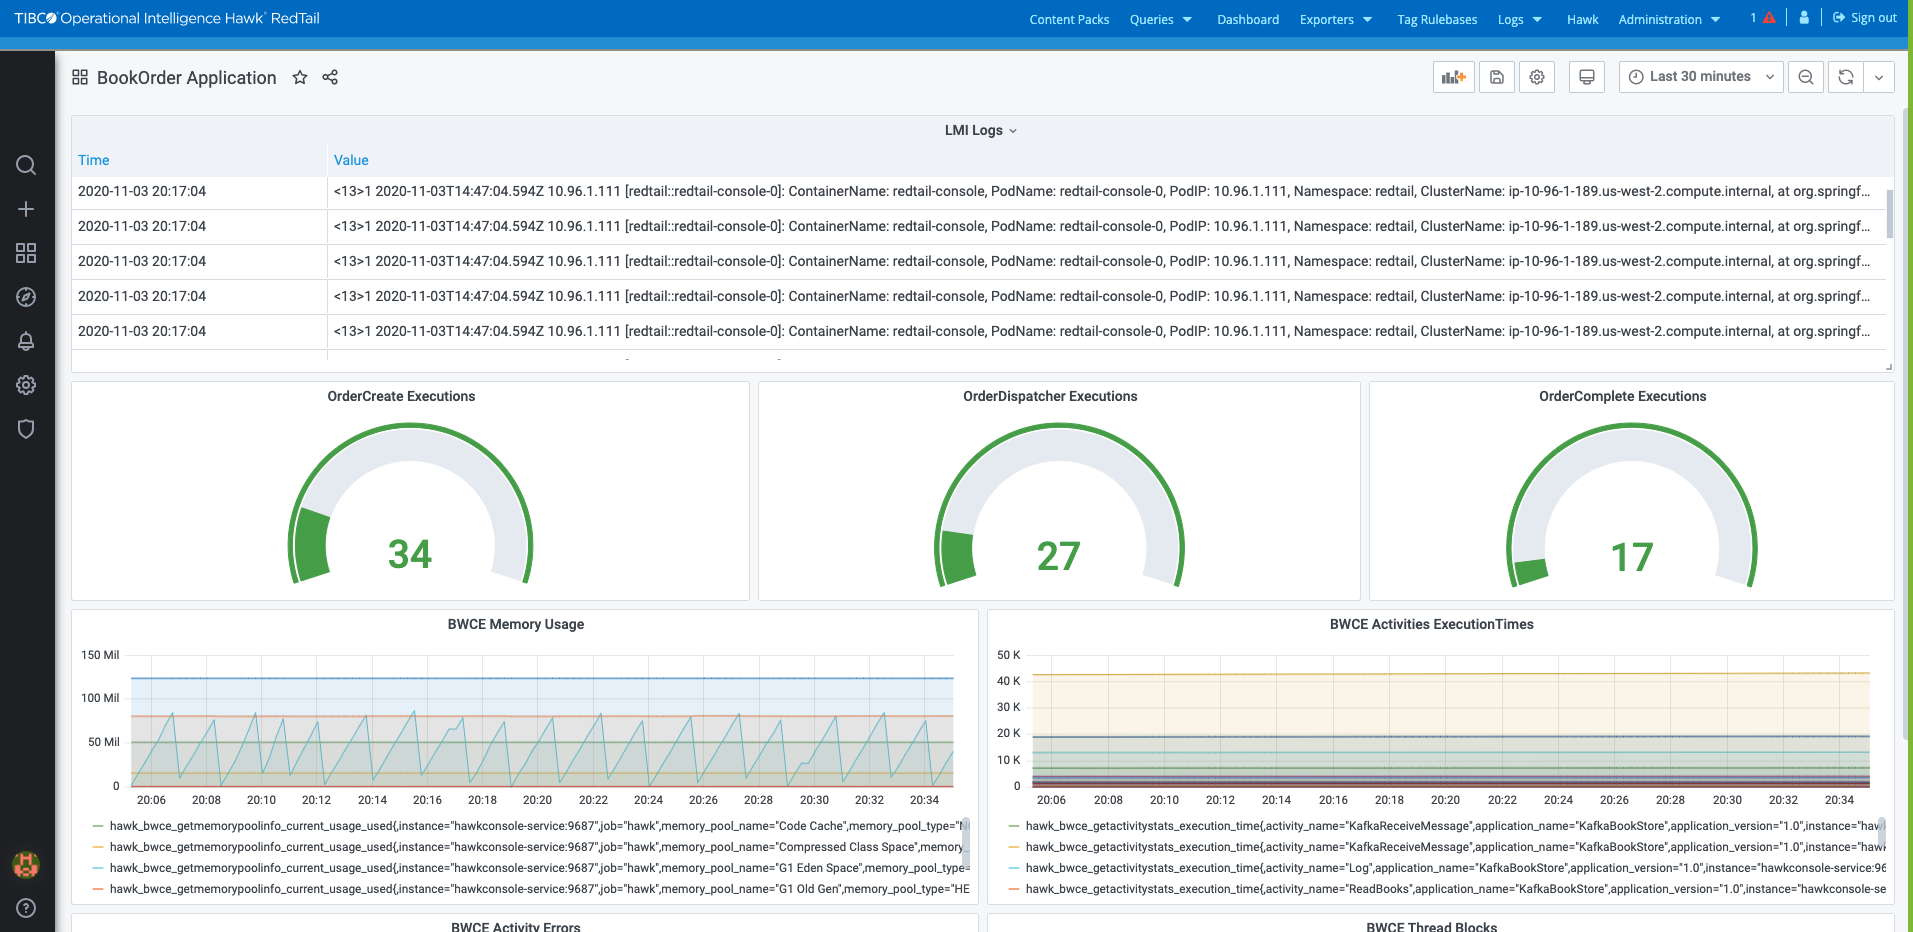
You can now customize dashboards in TIBCO OI Hawk RedTail - Container Edition. You can create and maintain multiple dashboards at once. You also have the ability to customize the panels within the dashboards in which multiple queries can be configured. Each panel use the visualizations such as line charts, tables, and gauges. The following image shows a dashboard which comprises different panels and visualizations. For more information, see Grafana Documentation.
In TIBCO OI Hawk RedTail - Container Edition, Grafana comes pre-installed with two data source plug-ins, namely Hawk RedTail Data source and Loglogic Data source. These data source are responsible fetching metrics and logs from TIBCO OI Hawk RedTail - Container Edition and TIBCO LogLogic Log Management Intelligence respectively, and then transform the results as per Grafana requirement. For more information about data source, see the following sections: