Monitoring

The Monitoring tab displays the details of the selected Service Instances of TIBCO ActiveMatrix BusinessWorks™ 5 or TIBCO ActiveMatrix® Adapters.

For TIBCO ActiveMatrix BusinessWorks5 the below process KPI metrics are listed:

  • Created Processes: The processes created by the process engine.

  • Suspended Processes: The process is suspended.

  • Swapped Processes: The total number of times processes were swapped up to current.

  • Queued Processes: The processes are currently queued.

  • Aborted Processes: The processes that are canceled.

  • Completed Processes: The processes that are completed.

  • Checkpoint Processes: The processes currently check-pointed.

  • Total Execution: The total execution time for all the processes. This refers to the total time that the process was running but does not include any wait times.

  • Average Execution: Average duration for execution of a process.

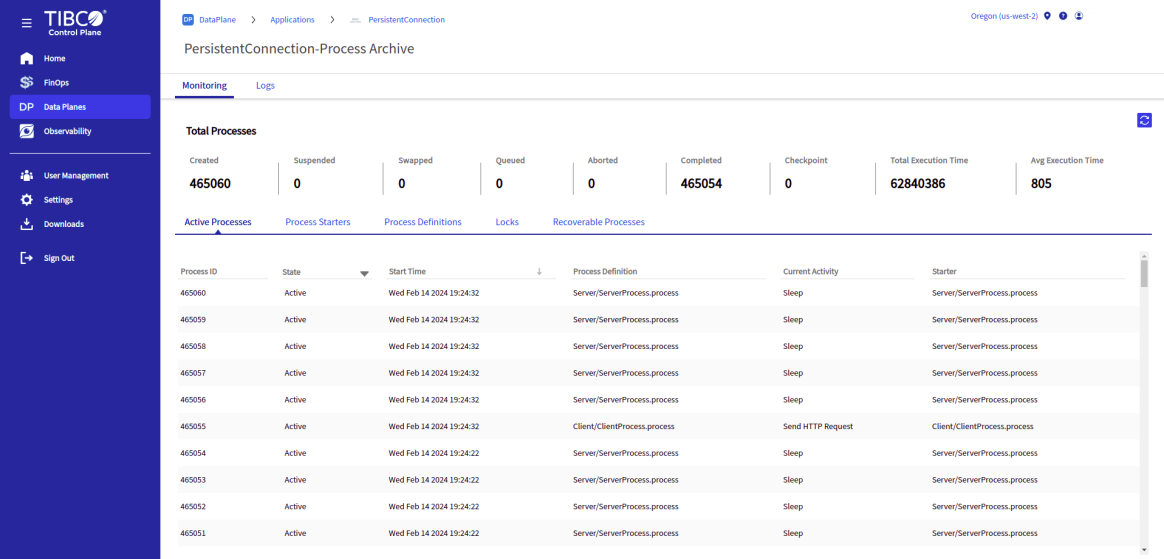
The below section displays different TIBCO ActiveMatrix BusinessWorks™ 5.x process types:

Fields Description
Active Processes

The active processes display the active process engines. As a rule, this includes process engines that are suspended or waiting.

  • Process ID: The process ID for this component.

  • State: The state of the process engine. Click the tab to filter the state according to Active, Inactive, or Suspended.

  • Start Time(in EPOCH): The start time of the process engine. You can sort according to Start Time (By default in ascending order).

  • Process Definition: The process definition describes the business process.

  • Current Activity: Displays the current activity.

  • Starter: The name of the process instance to handle incoming events.

Process starter

Displays the process instance names that handle incoming events.

  • Starter: The name of the process instance to handle incoming events.

  • Status: Displays the status of the starter process. Click the tab to filter the different statuses according to All, Active, and Inactive.

Process Definition

Displays the business process details with the following information:

  • Activity Name: The activity for which throughput is displayed. The activity name is search able.
  • Called Process: This field only shows information if you are running a process engine called by another process engine.

  • Execution Count: The number of jobs in which this activity is currently participating.

  • Elapsed Time (ms): The average time this activity took to complete.

  • CPU Time (ms): The CPU time used by this activity.

  • Errors: The number of errors encountered for this activity.

  • Status: The activity status. Click the tab to sort the status according to All, Ok, Dead, or Waiting.

  • Function: The name of the activity resource.

The execution count, elapsed time, errors, and CPU time can be sorted.

Locks

This section shows information about the list of lock owners and its waiting list.

  • Process ID: The Process ID for this component.
  • Lock Name: The name of the lock acquired by the user.
  • Wait Position: Displays the sequence number of the lock to be cleared. (0 being the first priority)

  • Requestor: The name of the requesting group.

Recoverable Process

Displays the process instances that have been checkpointed but not restarted.

  • Process ID: The ID of the running process instance.
  • Process Name: The name of the running process instance.
  • Status: The activity status.

  • Restart Activity: The activity used to restart or recover the process instance when an engine fails or encounters an unhandled exception.

For TIBCO ActiveMatrix® Adapters the details of AdaptersService Info and AdapterComponent Info are displayed:

Fields Description
AdaptersService Info

The AdaptersService Info returns information about the services implemented by the adapter application. The information is a summary of available adapter services.

  • Service Name: The name of the adapter service defined at design-time. Click the tab to search the Service Name.

  • Endpoint Name: The name of the endpoint used for a particular service.

  • Type: The type of the endpoint. For example: publisher or subscriber.

  • Quality Of Service: The quality of service for the endpoint. For example: RVCM or JMS persistent.

  • Subject: The subject defined for the endpoint.

  • Class: The class associated with the endpoint.

  • Number Of Messages: The number of messages processed for a particular endpoint. Click the tab to sort the number of messages.

AdapterComponent Info

The AdapterComponent Info returns information about the currently active TIBCO Hawk components such as publishers, subscribers, or timers.

  • Instance ID: The name of this adapter instance defined at design-time.

  • Adapter Name: The name of the adapter.

  • Component Name: The name of the component. Click the tab to search for a component.

  • Component Type: The name of the TIBCO Adapter SDK class for this component, such as Publisher, Subscriber, or IODescriptorSource.

  • Session Name: A session encapsulates the transport information of an adapter service.

  • Protocol: Displays the communication protocols, the protocol values can be RV, RVCM, orRVCMQ.

  • Description: The user-defined information about the particular component, such as time interval, signal type, and validating the publisher or subscriber.