Viewing Observability Dashboard
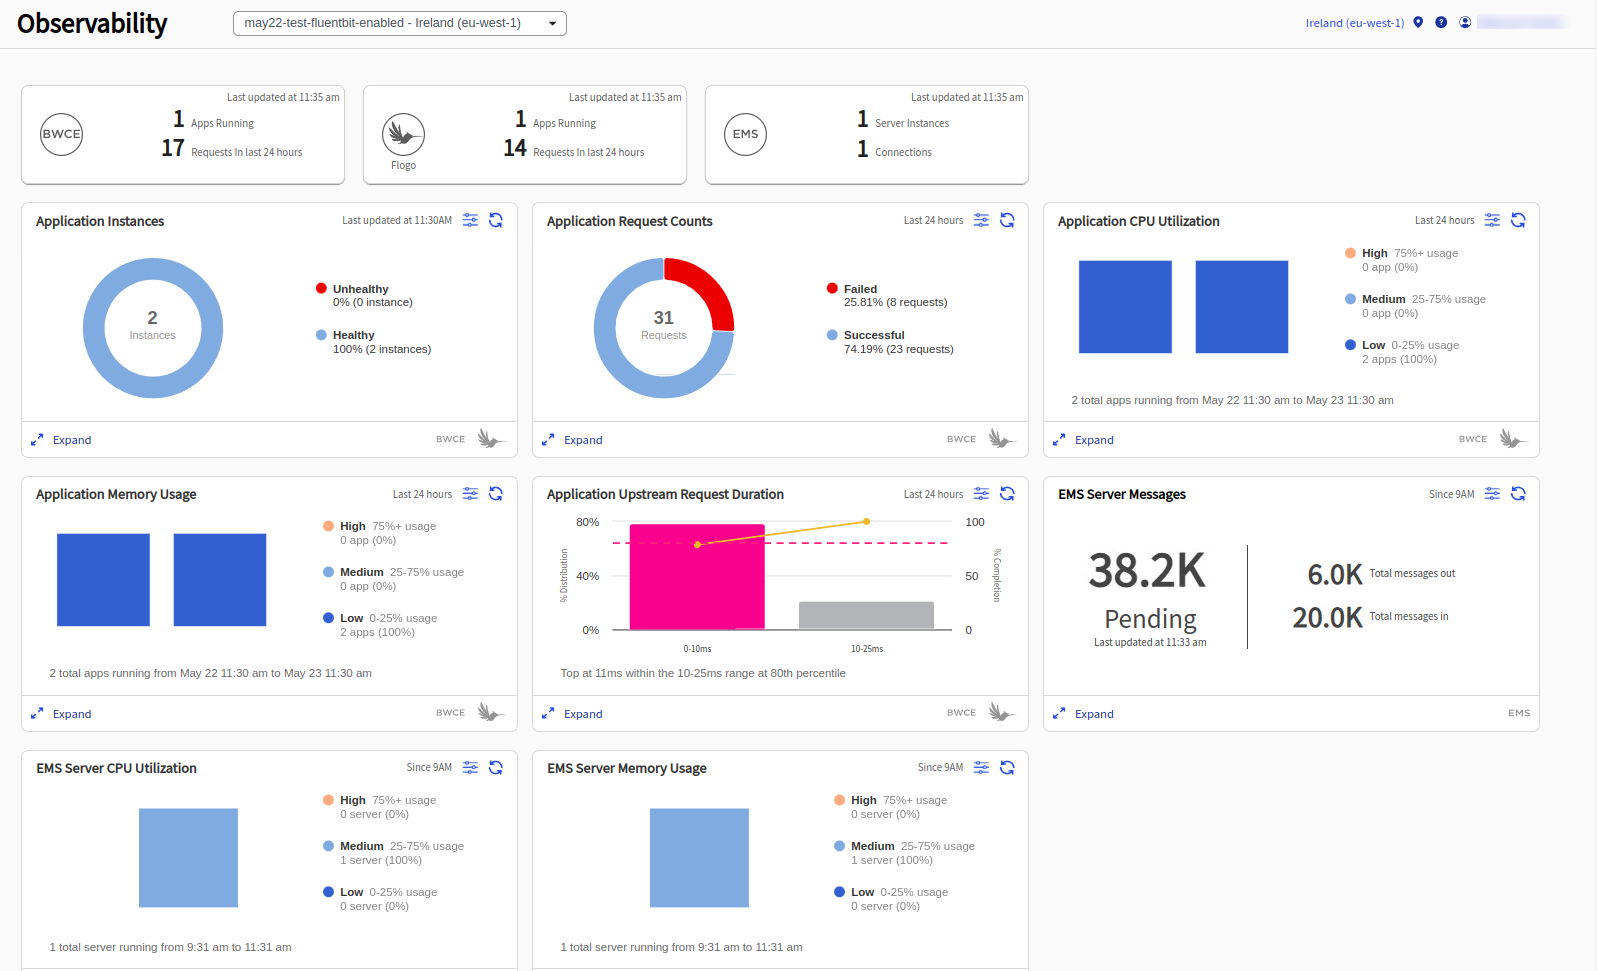
TIBCO Control Plane provides the dashboards such as Request Counts, CPU Utilization, Memory Usage, and Application instances. To view Observability dashboard, in TIBCO Control Plane, click Observability menu.
- You must have configured observability resource. See Configuring Observability Resource.
- You must have either Application Manager or View Applications permission to view observability dashboard. for more information, refer Permissions.
Observability dashboard provides graphical view (in the form of a chart, bar graph) for applications, request counts, CPU utilization, and memory usage. You can drill down the charts to view more information.
You can perform the following tasks on the Dashboard:
-
You can use the data plane filter at the top to filter data for a selected data plane. By default Global Observability Data Planes option is selected. It means data for all the data planes that use Global Observability resource is displayed. If you have explicitly configured observability resource at the data plane level, those data planes are listed in the filter.
-
To refresh the chart data, click Refresh
 .
. -
To drill down, click Expand on the card.
-
To filter the chart data, click the Filter
 icon. `
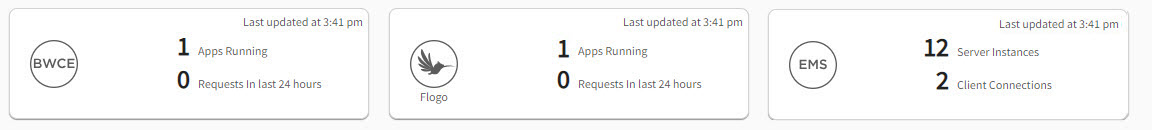
BWCE, Flogo, and EMS Summary Cards
BWCE and Flogo summary cards display the following information:
-
Number of BWCE or Flogo apps that are currently running on data planes
-
Total number of requests processed by the apps in the last 24 hours
EMS card displays the total number of EMS server instances deployed and the total number of EMS client connections.
The contents of these cards are auto-refreshed every 10 seconds.
Filtering Observability Data
You can filter data of card on the dashboard and details page by using different filters. By default all charts display observability metrics collected during last 24 hours except for the Application Instances card which displays real time data. You can filter data by time maximum upto last 48 hours.
-
You can specify one or more tags to filter data by tags. If multiple tags are applied, data from apps having at least one of the tags is displayed. You can specify maximum five tags at a single time.
-
For Application CPU Utilization card, you can use CPU usage threshold to filter by using the custom threshold percentage.
-
For Application Memory Usage card, you can use Memory usage threshold to filter by using the custom threshold percentage.
-
On the details pages, click
 to view more granular data. You must narrow the time range on the graph to enable this icon. To view granular data, the selected time range must be more than 5 hours.

The following topics provide detail information about each of the cards on the dashboard.