Application Upstream Request Duration
Application upstream request duration is the time required to complete the request by an application. The Application Upstream Request Duration Summary card applies to inbound HTTP requests successfully processed by BWCE and Flogo applications.
Application Upstream Request Duration card provides the following metrics:
-
The percentage distribution of requests completed in different request duration time ranges over the selected time range
-
The cumulative percentage completion of the total number of requests processed over the selected time range
-
The maximum request duration time to complete the specified Nth percentile of the total number requests
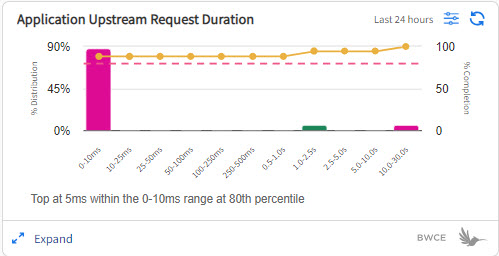
For example, as shown in the image, 80% of requests were completed within 0-10ms range. The bar chart displays the percentage distribution of requests completed in the time bucket on the horizontal axis. The line graph displays the percentage number of requests completed in the time bucket on the horizontal axis. The dotted line is the percentile that you have selected in the filter.
Application Upstream Request Duration Details Page
Application Upstream Request Duration details page displays the total number of application requests processed over time in the selected time range.
The time graph gives observability of the applications with relatively higher latency based on the request duration ranges observed in the selected time range. By zooming into the time range, you can narrow down to the exact participating app in the app list to do further analysis of an app with high latency.

You can view the following information on the Application Upstream Request Duration details page. The data displayed in the table is updated based on the time range that you select in the graph.
| Column | Description |
|---|---|
| All Capabilities | The name of capability in which application is deployed. |
| App Name | The name of the application. Click the application name to view the app details page in a new window. If you click the dropdown arrow in the last column, you can view application instance names. |
| Data Plane Name | The name of the data plane on which the application is deployed. |
| Requests |
The total number of requests processed by all the instances of the app. When you expand the application row, the Requests column displays the percentage distribution of requests across multiple application instances. |
| Top at nth percentile | The slowest request duration time for the selected percentile. For example, in the preceding screenshot, the slowest request duration is 30 seconds for the 80th percentile. This means that 80% of requests got completed in less than 30 seconds. |
| Average | The average of application requests duration time. |
| Current Status | The status column displays the current runtime status of an application. The status is reported by the monitor agent. For more information about app status, see Viewing Application Status. |
To view logs and traces, click the Expand ![]() icon in the first column. For more information, see Analyzing Logs and Traces.
icon in the first column. For more information, see Analyzing Logs and Traces.